










Why Your Dashboards Show Different Numbers.
And How to Fix It.
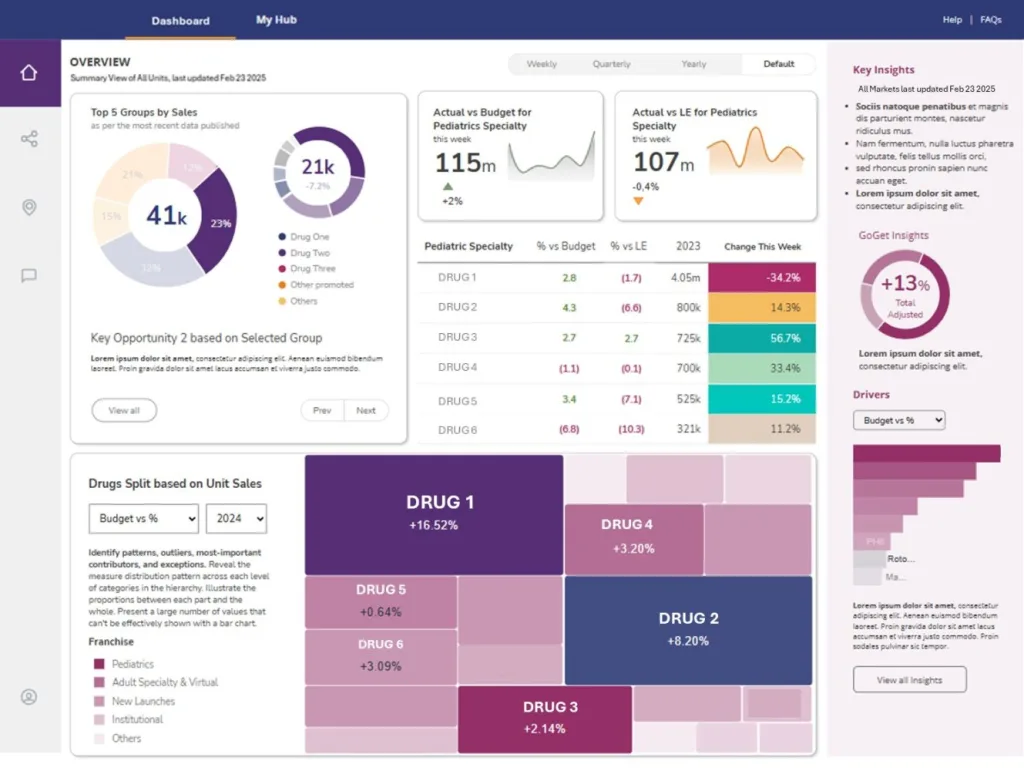
It happens in almost every leadership meeting. Someone pulls up the sales dashboard. Someone else references the finance report. The numbers don’t match. Fifteen minutes get spent debating which one is right before the actual agenda item even starts.
This is the dashboard reconciliation problem. Two dashboards, same business question, different answers. And it’s one of the fastest ways to destroy trust in your entire analytics investment — because once a number gets questioned in a meeting, every number from every dashboard gets quietly discounted afterward.
Why This Happens
Dashboard reconciliation failures almost always trace back to one of four causes. Understanding which one you’re dealing with determines the fix.
Different source systems. The sales dashboard pulls from Salesforce. The finance report pulls from the ERP. Salesforce closes deals when the contract is signed. The ERP recognizes revenue when the invoice is paid. Both are correct — they’re measuring different moments in the same process. But when leadership sees “Q3 revenue” showing two different numbers, they don’t see a timing difference. They see a broken analytics environment.
Different metric definitions. “Active users” means monthly logins in one dashboard and weekly logins in another. “Revenue” includes refunds in one view and excludes them in another. “Pipeline” counts all open opportunities in the CRM in one report and only qualified opportunities in another. Nobody made a wrong decision — they made different decisions, at different times, in different parts of the organization. The result is definitional chaos.
Different time zone or timestamp handling. This is the silent killer. A transaction that happens at 11:45 PM EST on December 31st is in Q4 if you’re using Eastern time and Q1 if you’re using UTC. In global organizations, this single issue can produce six-figure discrepancies between dashboards that are technically both correct.
Different data freshness. One dashboard runs on a live connection. Another runs on an extract that refreshes nightly. At 9 AM on a Monday, they show different numbers for Friday because one has weekend data and one doesn’t. Nobody notices the refresh schedule difference. They just notice the numbers don’t match.
The Real Cost
The obvious cost is the meeting time spent reconciling numbers instead of making decisions. A 15-minute debate in a weekly leadership meeting is 13 hours a year for a team of 10 — before you account for the follow-up emails, the Slack threads, the analyst who gets pulled off their actual work to explain why the numbers are different.
The hidden cost is worse. When leadership doesn’t trust the dashboards, they stop using them. They revert to the spreadsheet the CFO has been quietly maintaining, the export someone pulls manually every Monday morning, the gut instinct of the person who’s been in the business the longest. The analytics investment stops producing decisions. The analytics team stops getting credit for the work they’re doing. And the organization makes decisions with worse information than it should have.
The Fix
Fixing dashboard reconciliation requires addressing the root cause, not the symptom. Reconciling the numbers after the fact — “let me explain why these are different” — is a band-aid. The actual fix is building a system where the numbers can’t conflict in the first place.
Define metrics once, centrally, and enforce it everywhere. This is what a semantic layer does. Whether you build it in dbt, in your BI platform’s semantic model, or in a dedicated metrics layer, the principle is the same: “revenue” has one definition, one calculation, one source. Every dashboard that shows revenue reads from that definition. If the definition needs to change, it changes once and propagates everywhere.
Document the source of truth for every key metric. For each metric your organization cares about, someone needs to own the answer to: which system is authoritative? How is it calculated? What does it include and exclude? What’s the refresh cadence? This documentation doesn’t need to be elaborate — a shared doc with a table works — but it needs to exist and it needs to be enforced.
Build dashboards from the same data layer, not from source systems directly. When every dashboard connects directly to a different source system, reconciliation is structurally impossible. When every dashboard connects to a governed data warehouse with a consistent transformation layer, reconciliation happens in the warehouse once rather than manually in every meeting forever.
Show your work in the dashboard itself. The most underused technique for building data trust is transparency. Put the data source, the calculation definition, and the last refresh timestamp in the dashboard. Not hidden in documentation somewhere — visible in the dashboard. When a VP sees “Revenue = Gross Sales minus returns, sourced from NetSuite, refreshed daily at 6 AM,” the “which number are we using” conversation stops before it starts.
How Long Does This Take?
For most organizations, fixing the core reconciliation problem for the five to ten metrics that matter most takes four to six weeks — not months. The inventory, definition, and data modeling work is bounded once you’re clear on which metrics need to be authoritative and which source systems feed them.
What takes longer is the cultural shift: getting teams to agree on definitions, getting leadership to stop maintaining their own versions in parallel, and getting the analytics team to hold the line on governance instead of building one-offs on request. That’s change management, not data engineering — and it requires a different kind of attention.
If your leadership meetings are still starting with “which number are we using,” we’ve fixed this problem before. It’s faster than you think.
Request a Conversation →