










UI/UX Strategy for Commercial Intelligence
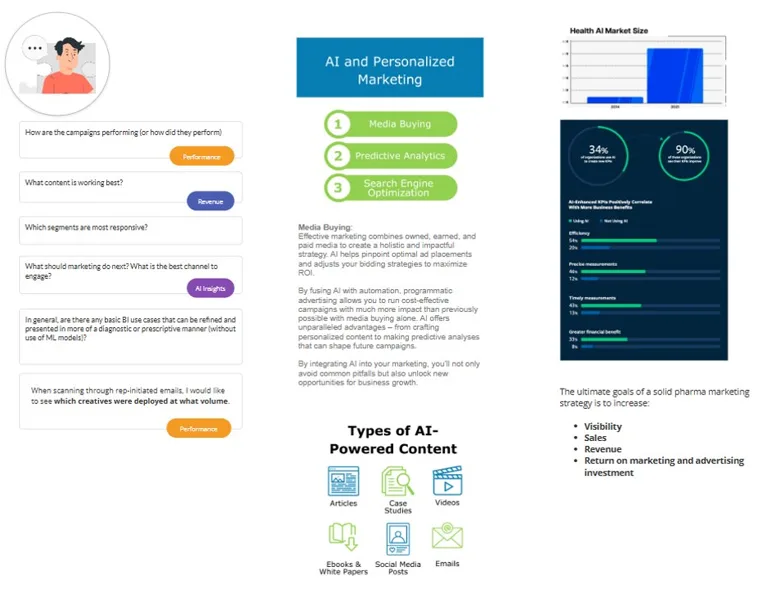
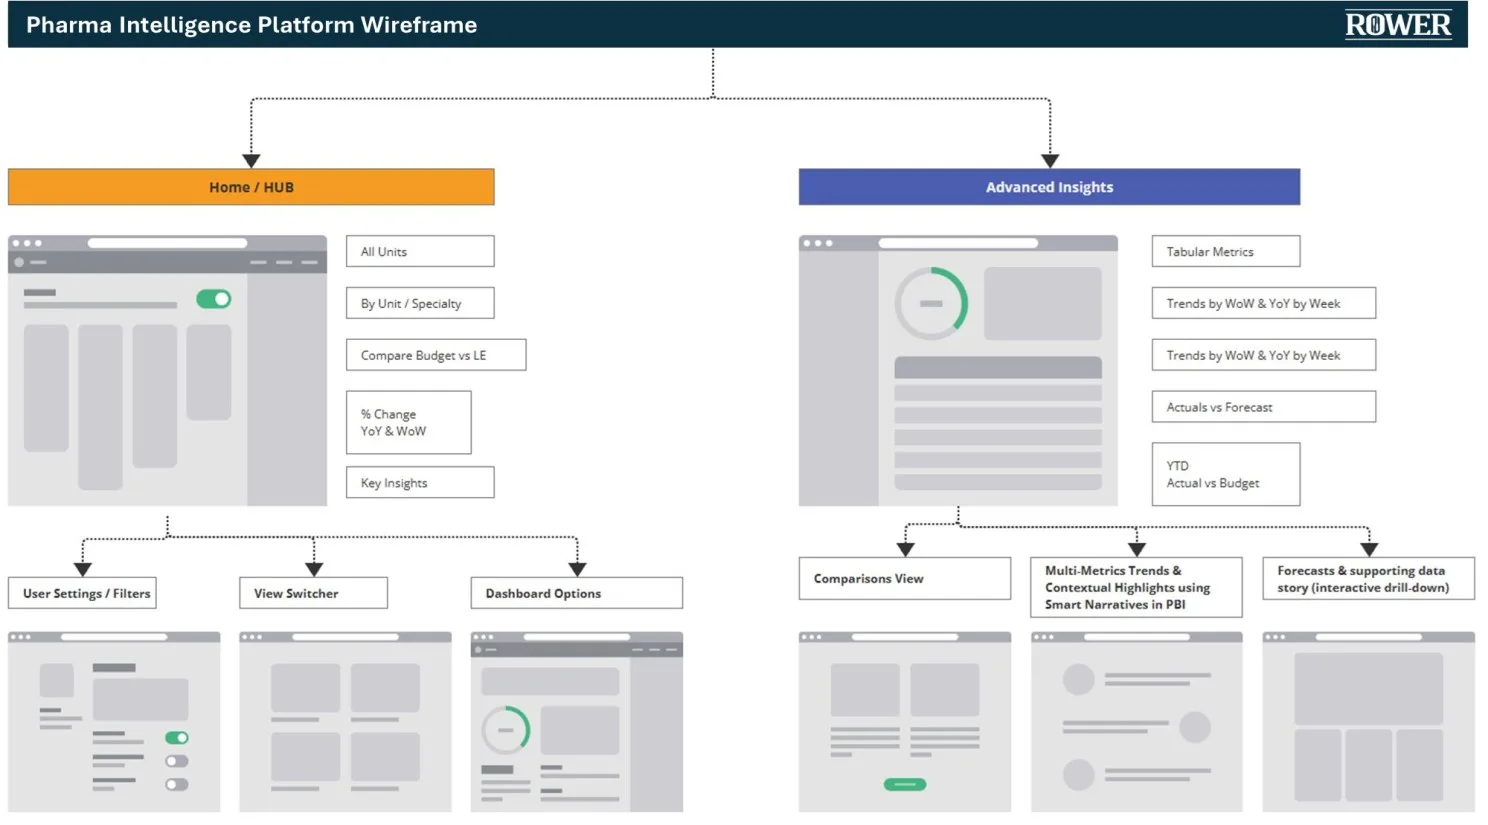
We designed Pharma IQ around how commercial leaders actually explore revenue—from executive KPI snapshots to franchise-level drill-downs. Every screen in this strategy was tested iteratively with mid-fidelity wireframes before shipping production UI.
From Authentication to Compliance
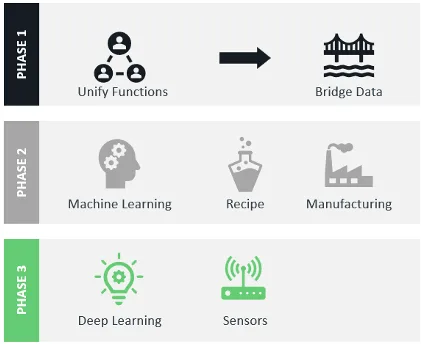
A phased pipeline maps every interaction layer—discovery workflows on the left, collaboration and governance on the right.
Steps 1–5 · Core Workflows
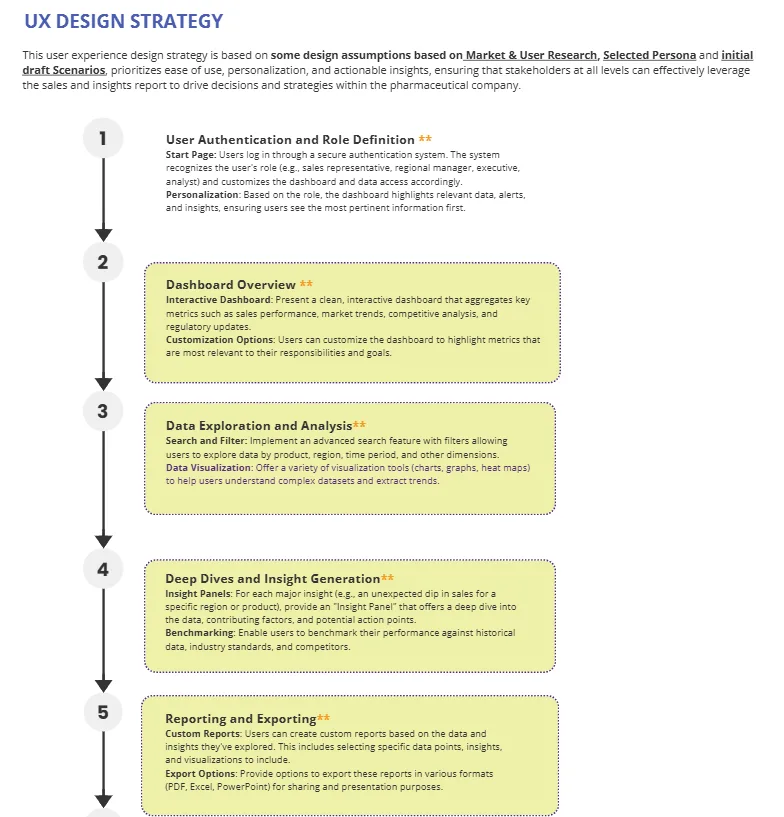
- User Auth & Role Setup
- Dashboard Overview
- Data Exploration & Slice-and-Dice
- Deep Dives
- Exporting / Reporting
Steps 6–10 · Scale & Governance
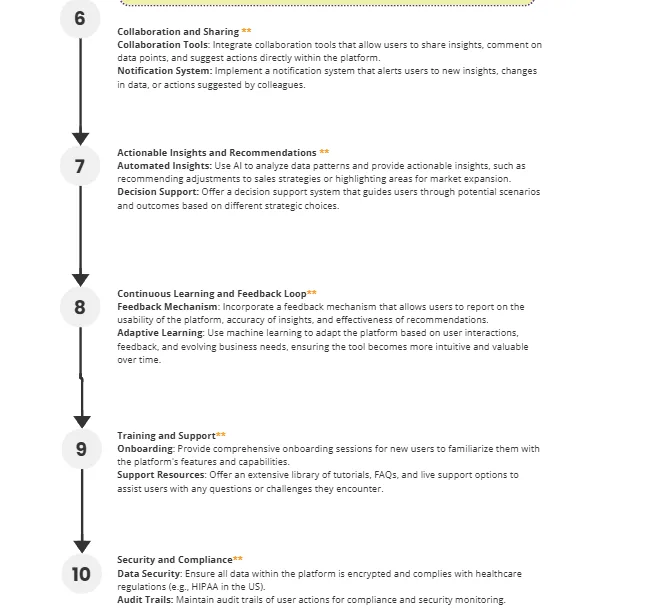
- Collaboration
- Actionable Insights (AI Narrative)
- Feedback Loop
- Training & Support
- Security & Compliance
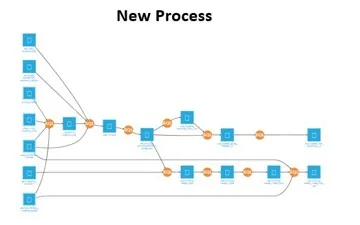
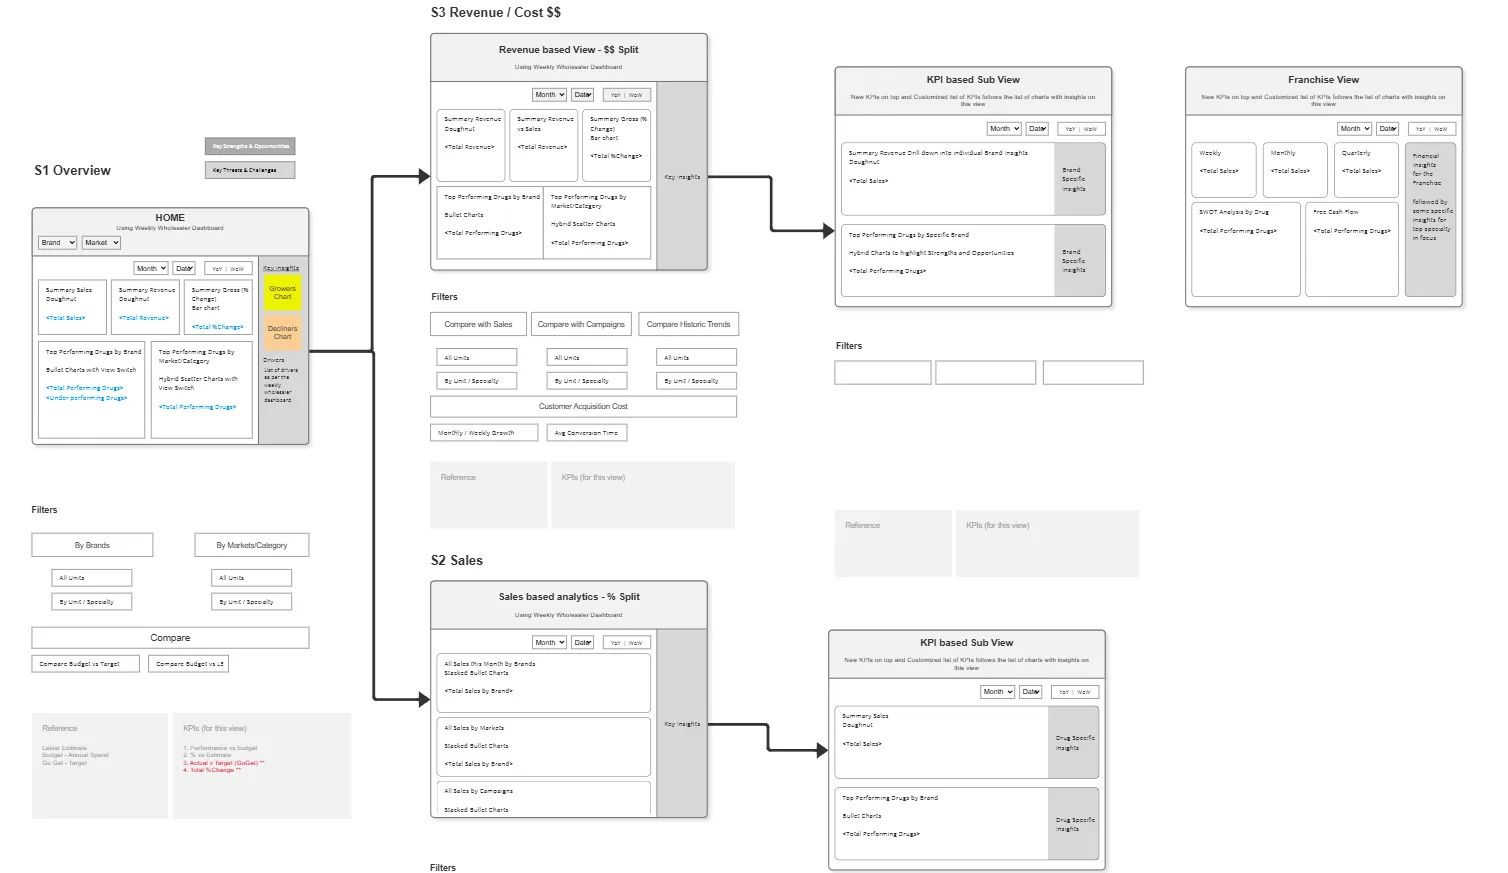
Drill-Down Pathway Map
Users enter at S1 Overview, split into revenue and sales analytics, then descend into brand- and drug-level franchise views.
Iterative Wireframe Gallery
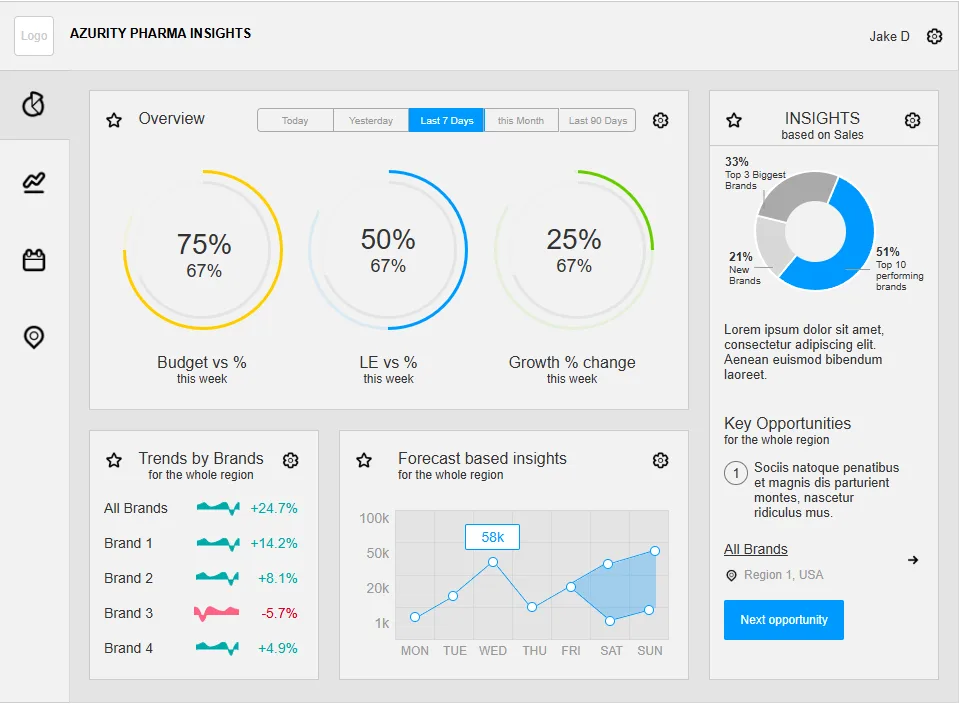
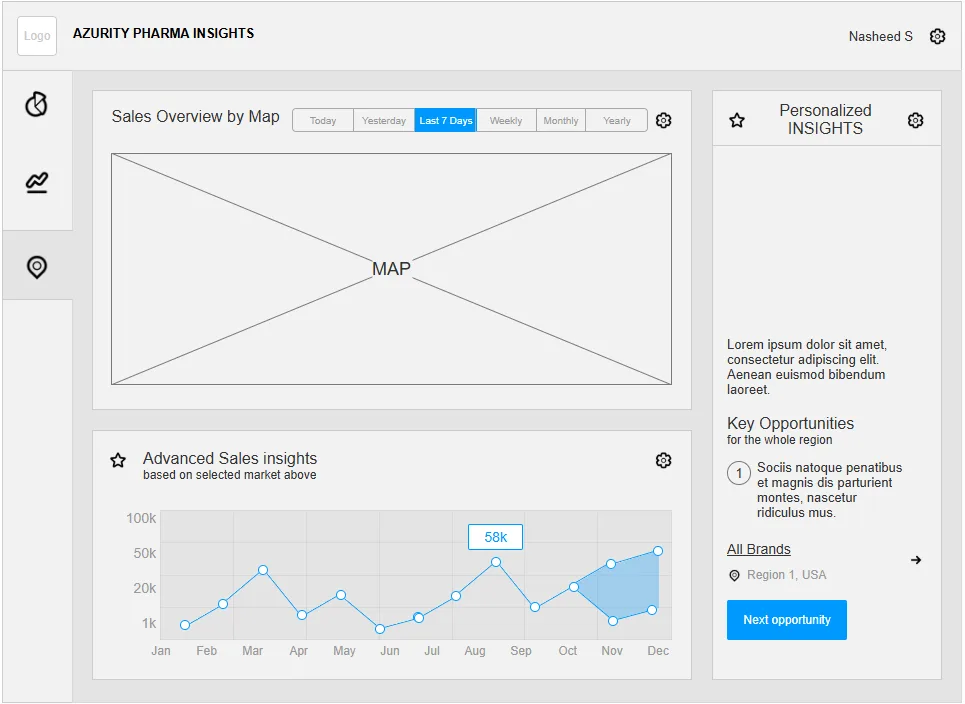
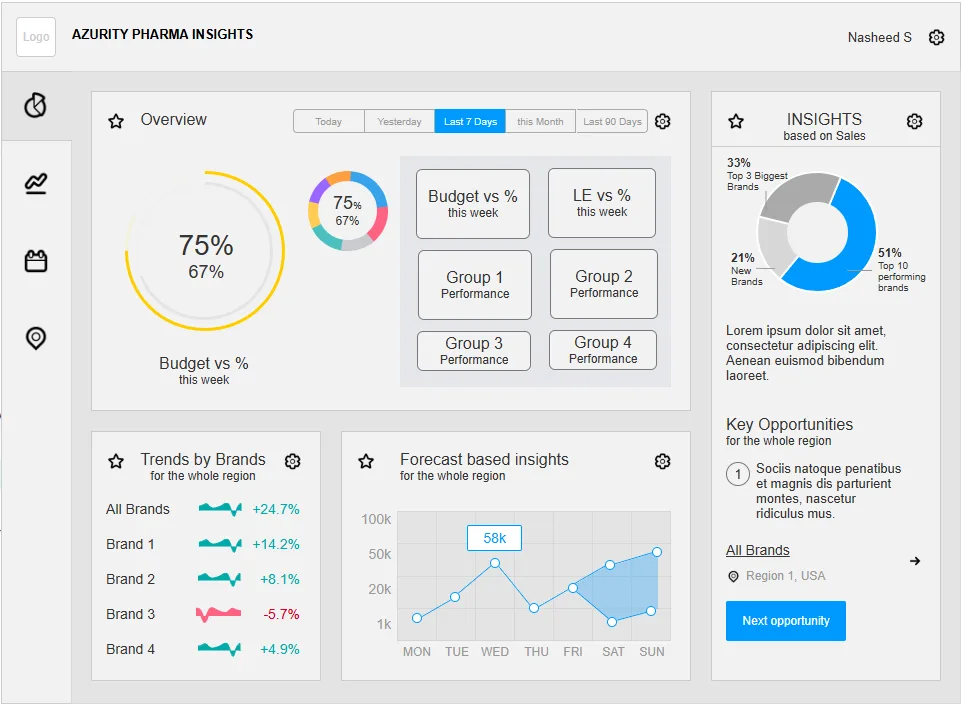
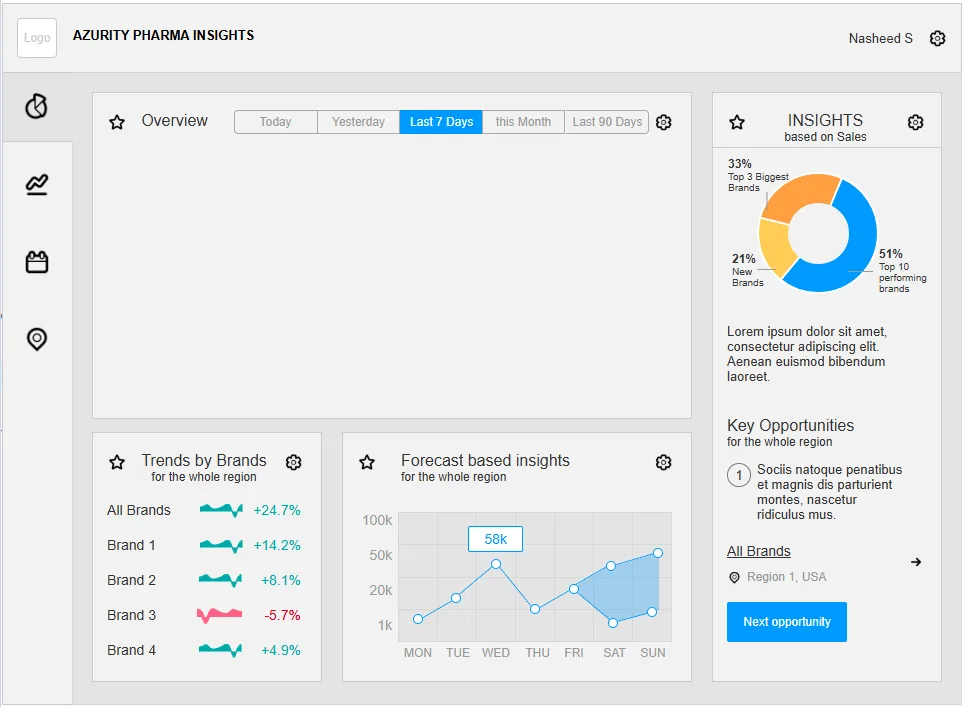
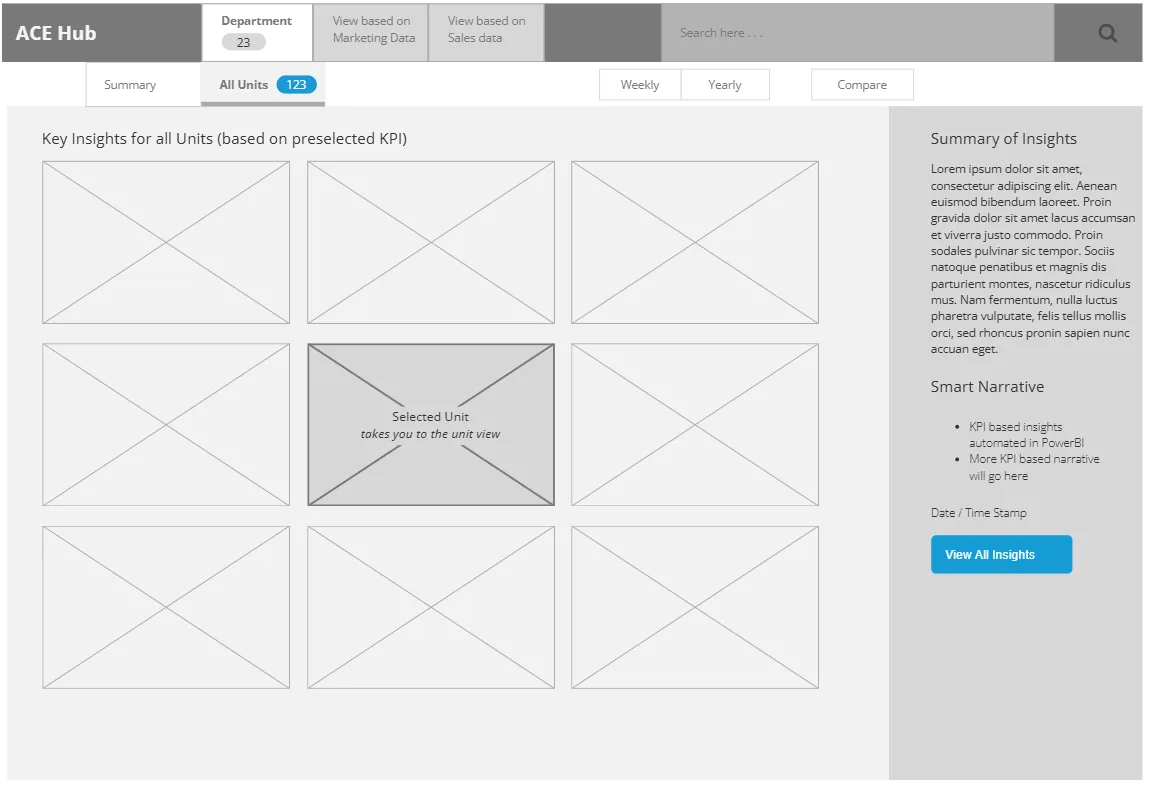
Seven component explorations validated layout density, filter patterns, and AI insight placement before high-fidelity build.
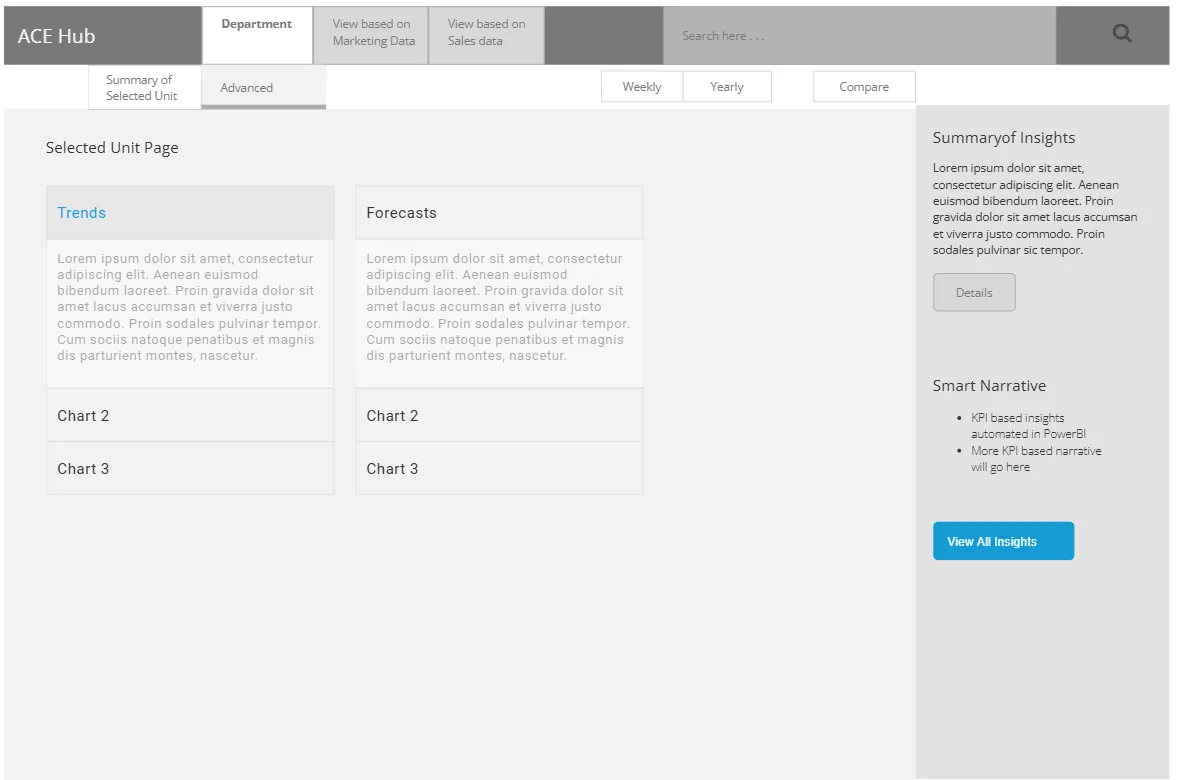
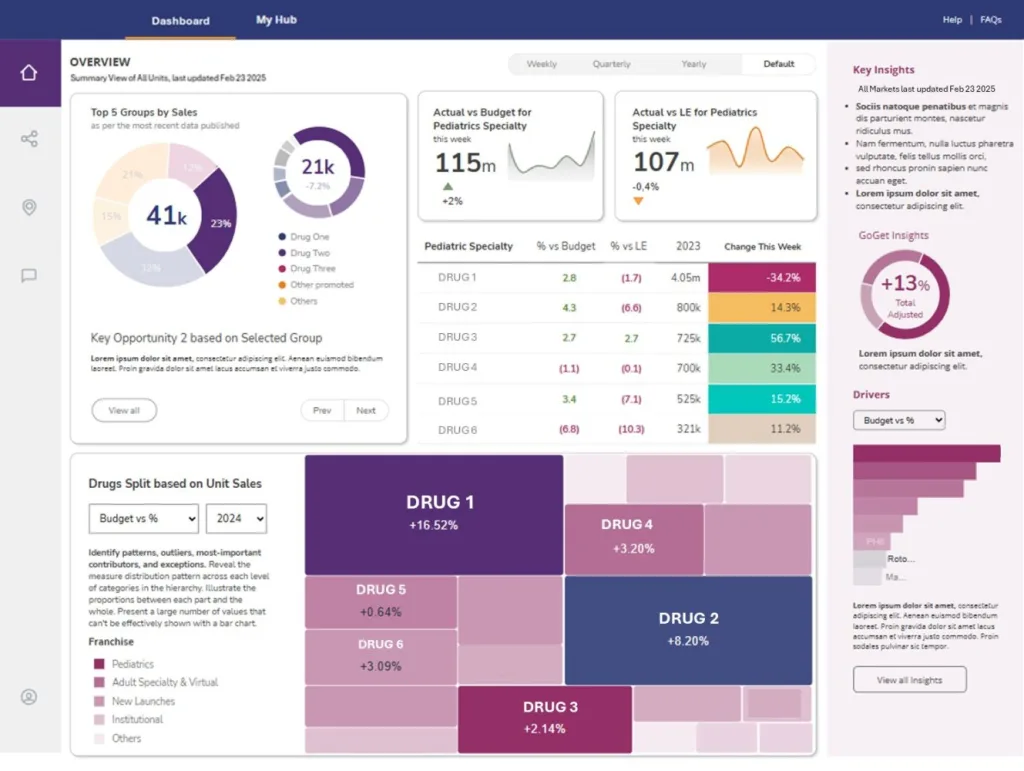
Production Showcase
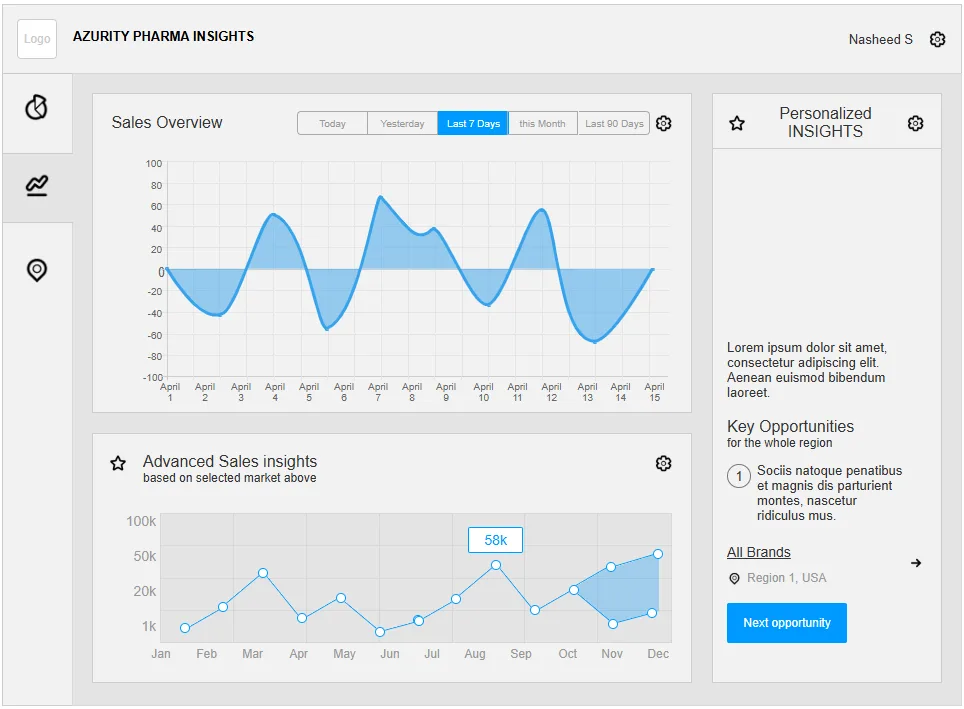
Wireframe decisions shipped as polished dashboards—regional performance maps and campaign heatmaps with cohort analytics.
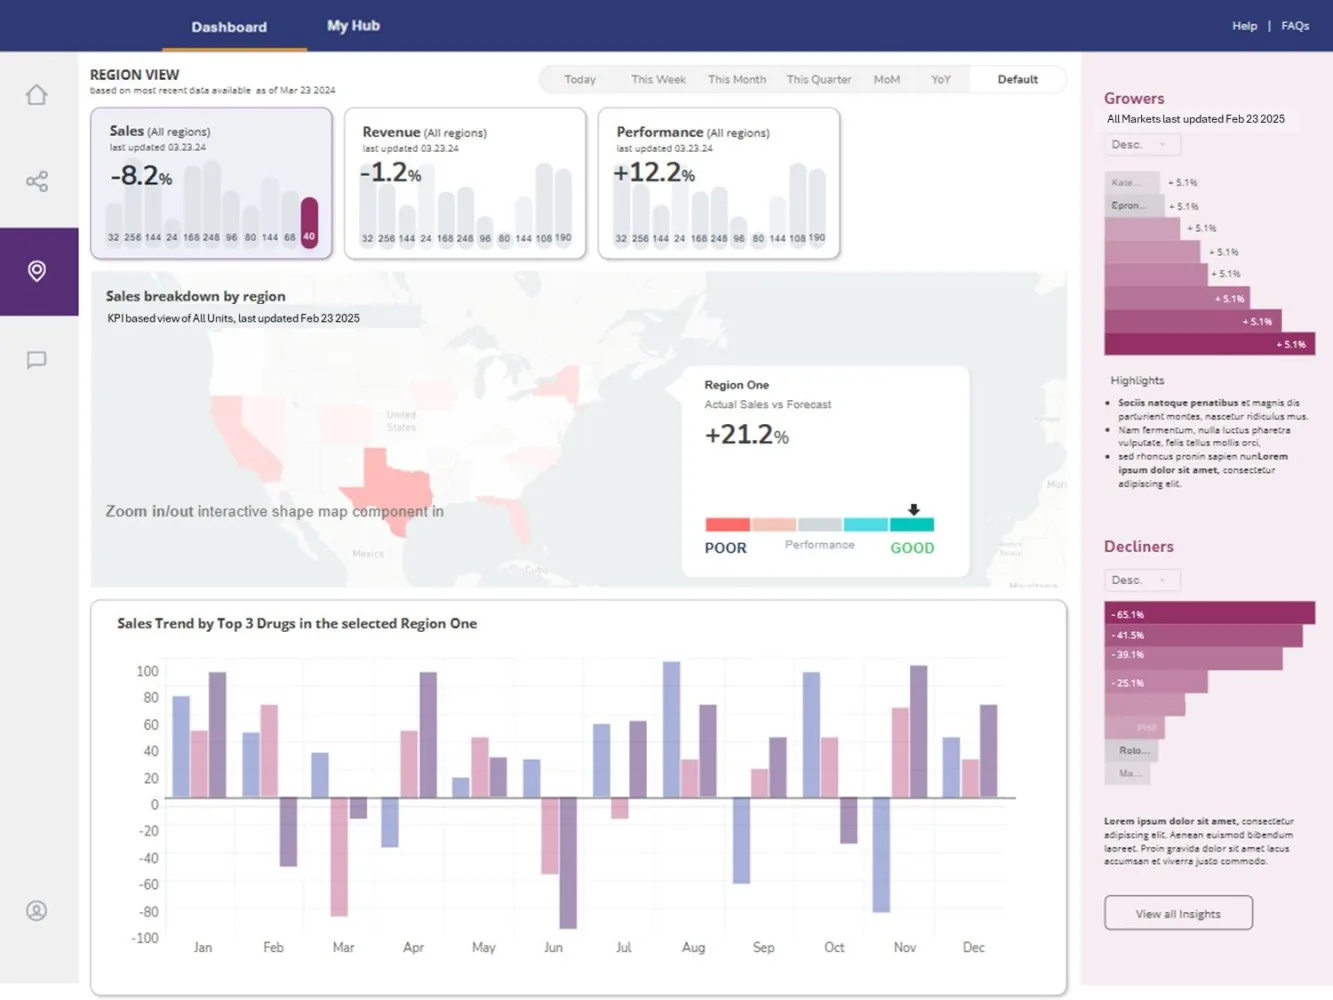
US shape map surfaces regional growers and decliners at a glance for leadership reviews.
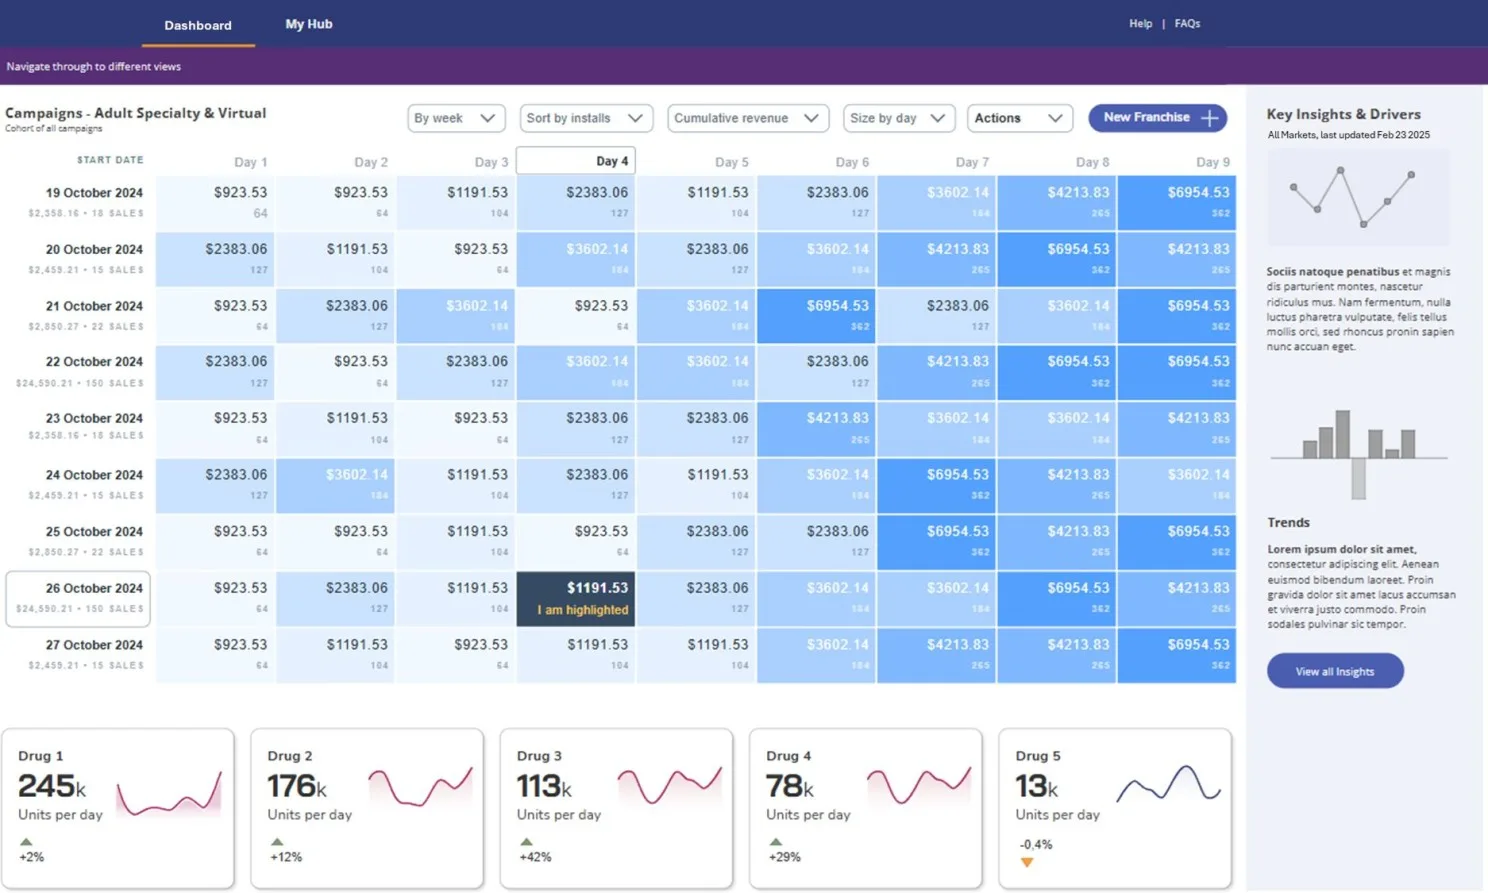
Cohort grids and drug performance sparklines reveal campaign lift across therapeutic segments.
From Static Blocks to Visual Strategy
The legacy single-image wireframe link is replaced with modular strategy cards—each artifact maps to a validated design decision.
Pathway Architecture
S1–S3 hierarchy defines how users move from overview KPIs into revenue, sales, and franchise sub-views.
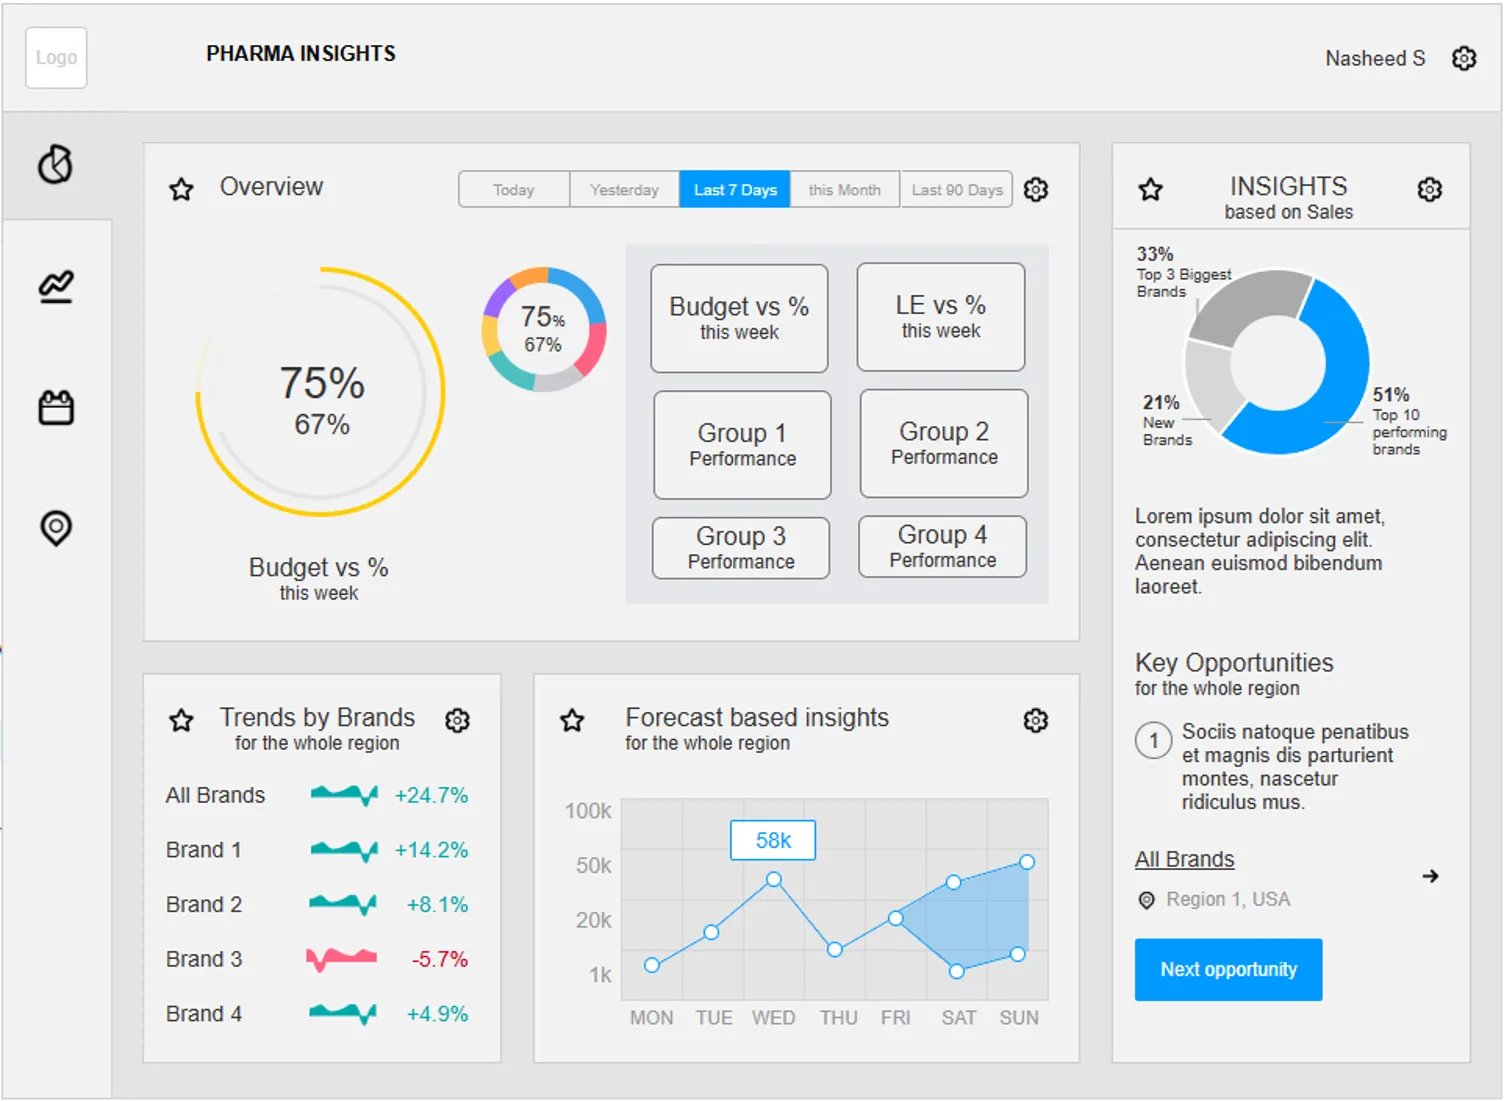
Component Library
Seven wireframe iterations tested gauges, sparklines, maps, and drawer patterns before production build.
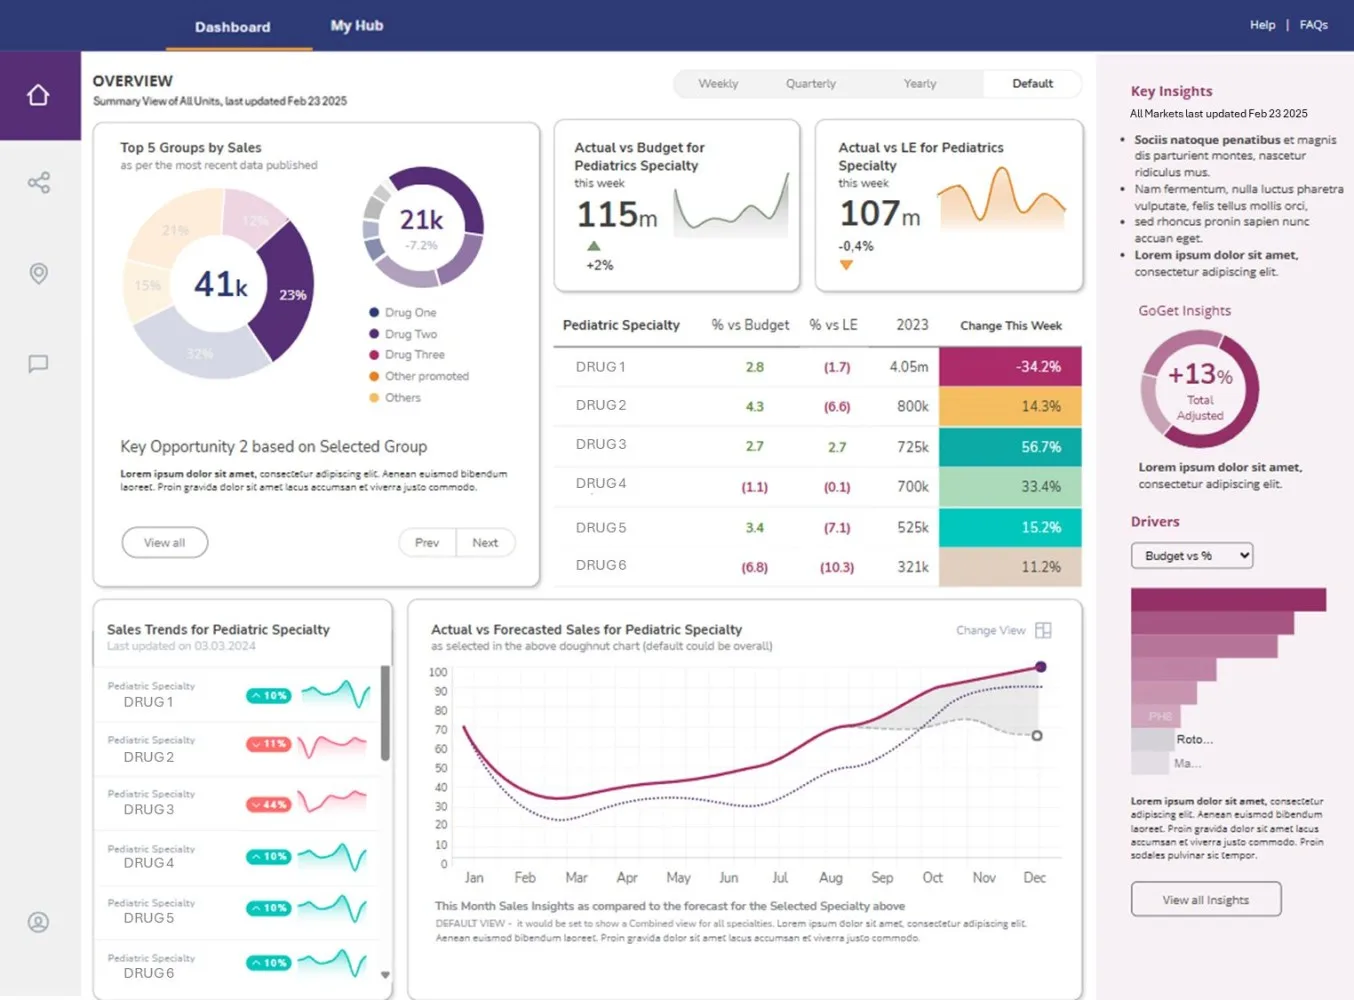
Production UI
High-fidelity screens prove the strategy—regional maps, heatmaps, and AI narratives ready for deployment.