










How Rower Automated Multi-Year Planning for a Large Life Insurance Company Using Alteryx
For a large life insurance company, Multi-Year Planning (MYP) meant weeks of manual data wrangling — actuarial outputs from AXIS, investment income vectors, reinsurance assumptions, and intangibles files all processed by hand before FP&A could begin building the plan. Rower replaced that process with a fully automated Alteryx workflow that delivers GAAP and Statutory reporting outputs to both FP&A and Tableau — automatically, accurately, and in compliance with Model Risk Management requirements.
The Problem: Manual MYP Was a Regulatory and Operational Risk
Multi-Year Planning in life insurance is not a simple forecasting exercise. It sits at the intersection of actuarial modeling, financial reporting, investment strategy, and regulatory compliance — and it has to be right twice: once for GAAP and once for Statutory (SAP) reporting.
For this client, the status quo looked like this: the FP&A team received raw actuarial output files from AXIS — the industry-standard actuarial modeling platform — for every product line: IUL, UL, Traditional Life, Protection Annuity, DA Annuity, FIA Annuity, and FHLB. Each file arrived in a different format, with columnar year data that had to be transposed, field names that had to be parsed and normalized, and reinsurer designations that had to be manually coded. Then investment income had to be calculated from NER vectors. Then mapping lookups applied. Then sign flip logic. Then MoM change calculations. Then quarterly and annual rollups for the FP&A output, separately from the monthly detail needed by Tableau.
Every step was manual. Every step was error-prone. And every step was subject to the scrutiny of Model Risk Management — the regulatory framework that requires life insurers to document, validate, and independently review every model that materially influences financial decisions.
- Model Risk Management (MRM) Policy: Insurance regulators and internal model governance frameworks require that any workflow materially influencing financial forecasts be documented, validated with UAT on every change, and subject to independent review. Manual Excel-based processes cannot satisfy this standard reliably.
- Dual GAAP / Statutory Reporting: Life insurers must produce both GAAP and Statutory plan outputs — using different reserve methodologies, different investment income bases, and different sign conventions. A single manual process serving both creates reconciliation risk that auditors flag.
- Upstream/Downstream Model Dependencies: AXIS actuarial outputs feed directly into FP&A plan inputs, which feed downstream into reserve calculations, capital planning, and regulatory filings. MRM policy requires that these dependencies be documented and that data integrity be traceable end-to-end — impossible with a manual process.
- BAU Controls and Audit Trails: Regulators expect business-as-usual controls — repeatable, documented steps that produce consistent results regardless of who runs the process. Manual data preparation introduces operator-dependent variation that fails this standard.
The answer wasn’t a better spreadsheet. It was automation with full documentation — and that’s exactly what Rower built.
The Data Challenge: 22 Inputs Across Six Source Types
Before a single calculation could run, the workflow had to ingest and normalize data from six fundamentally different source types — each with its own format, structure, and ownership.
IUL NB, PA Inforce, UL US & NY, Traditional, DA Annuity, FIA Annuity, FHLB, DA NB, FIA NB. Each arrives with concatenated field names that must be parsed into structured columns — Line of Business, Entity, Distribution Channel, and Segment — and columnar year data that must be transposed to one row per period.
DAC and other intangibles for new business and inforce. Columnar date format converted to YYYYMM row format and normalized to match the AXIS data stream before union.
FP&A mapping table, deferral & quota share percentages, reinsurer flags for GAAP/Stat net view, reinsurance letter-of-credit vectors, and monthly LOC cost schedules. The mapping file drives how every AXIS field name resolves to an FP&A line item, category, formula, and sign.
Net Economic Rate vectors for GAAP and Statutory investment income calculations. Applied via formula using prior-month reserve balances, premium, and commission values — separately for ceded vs. non-ceded positions and for UL/Traditional vs. annuity products.
Supplemental data created by the FPA team in a format structured to match the final Excel output — loaded and appended rather than transformed.
Option balance and hedge gain manual adjustment file loaded from the FP&A team and incorporated into investment income and hedge gain calculations.
The Alteryx Workflow: 6 Phases, 28 Containers
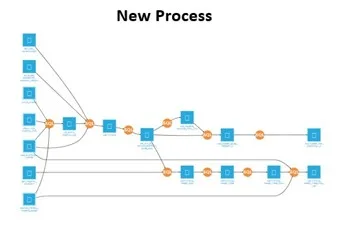
The workflow was built in Alteryx with 28 documented containers organized into six logical phases. Every phase is documented in the MRM model register with owner designation, tool inventory, and assumption log — satisfying the independent validation requirement.
How It Works: Phase by Phase
All 22 source files loaded in a single run: 10 AXIS product-line outputs, 2 intangibles files, 6 mapping tabs, 2 NER vector tabs, 1 Kubera file, and 1 hedge/option balance file. Dynamic load architecture eliminates manual file selection.
Concatenated AXIS field names are parsed into structured columns — Model Run, Line of Business, Entity, Distribution Channel, and Business Segment. Columnar year data transposed to one row per period. Dates standardized to a consistent format. New Business vs. Inforce designation coded from the source file. Reinsurer designations coded and null fields filled per mapping rules.
The heart of the workflow. NER vectors joined to compute GAAP and Statutory investment income separately — using prior-month reserve, IMR balance, premium, and commissions as the earning asset base, compounded monthly. Month-over-month change calculations computed for reserves, account value, hedge gain, and other liabilities — with the first six months of the plan year correctly zeroed (no prior-year comparison base). Commissions net of deferral, DAC, Floating Withholding Liability, Account Value Rollforward, and 10+ additional metrics all calculated in this phase.
Data stream joined to the FP&A mapping table — resolving every AXIS field to an FP&A Category, Line Item (three levels), Formula, Sign Flip flag, and Aggregate/Balance flag. After mapping: pre-tax statutory income, operating income before interest and taxes (GAAP), and Floating Withholding Liability created as derived fields. Account Value Rollforward logic applied. Letter-of-credit calculations and affiliated reinsurer data streams unioned into the main output.
Sign flip logic applied to all flagged fields (multiply value by -1 where required for regulatory sign convention). Null and zero rows removed. FAB data excluded. Specific TRAD/IF rows for change-in-stat-reserve removed per business rules. Expense allowance logic applied to FP&A Line Item hierarchy. Date range floor set for historical data limit.
For FP&A Excel: data rolled up to quarterly and annual level using the Aggregate/Balance flag — aggregate fields summed, balance fields using period-end value. Output delivered as a structured Excel workbook for FP&A use. For Tableau: monthly detail written directly to a SQL Server reporting database without the rollup step. Unmapped AXIS fields archived for review. Multiple iterations supported as FP&A and Tableau users identify adjustments.
Two Outputs, One Source of Truth
Quarterly and annual rollup of all GAAP and Statutory plan metrics by product line, LOB, entity, and reinsurer. Aggregate fields summed across periods. Balance fields set to period-end value. Formatted for direct use in FP&A modeling — no manual data manipulation required on delivery.
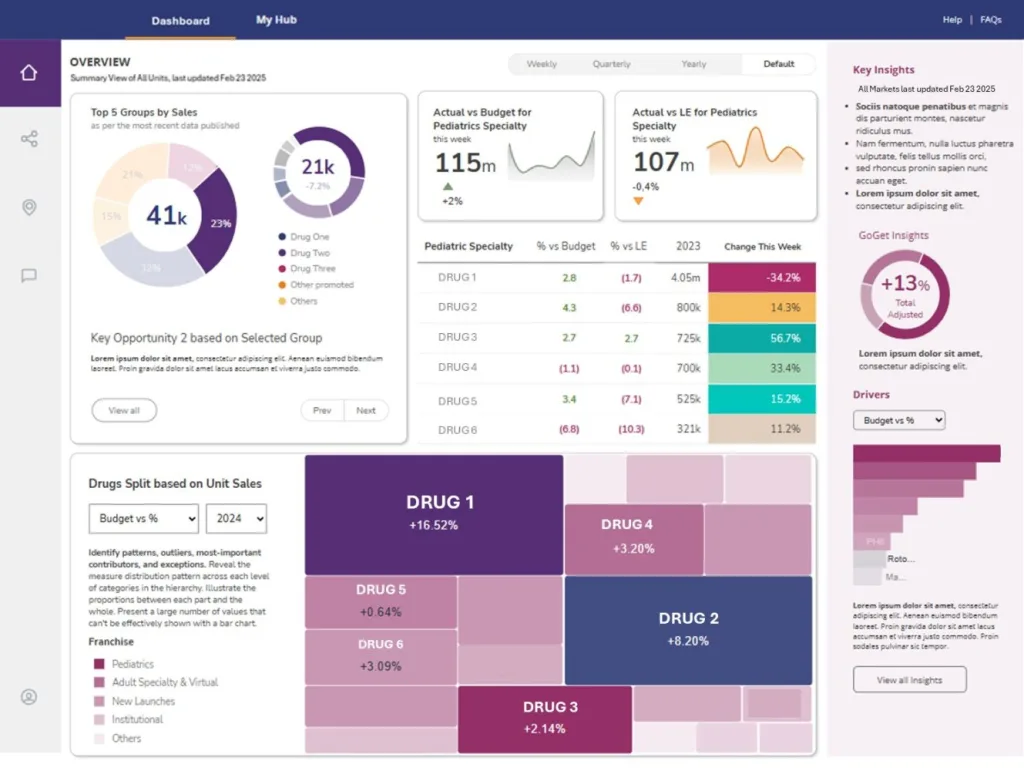
Monthly-level detail written to SQL Server for live Tableau dashboards used by the retail team for plan review. No quarterly rollup — full monthly granularity preserved. Refreshed automatically on each workflow run, enabling iterative review as the plan evolves.
Built for MRM: The Regulatory Foundation
Insurance regulators and internal model governance teams don’t just care that your numbers are right — they care that you can prove it, document it, and independently verify it. The Alteryx MRM documentation framework built alongside this workflow addressed every requirement:
Every workflow container is documented with owner designation, tool inventory, assumption log, and change history. BAU controls are defined for every version. Upstream and downstream model dependencies — AXIS as the upstream actuarial model, FP&A planning and reserve calculations as downstream — are mapped and documented. UAT is required on every change. Independent validation is on file. The workflow is not just automated — it is auditable.
This is the standard that life insurance companies operating under NAIC Model Regulation, Solvency II-adjacent frameworks, or internal model risk policies are held to. A manual Excel-based MYP process cannot satisfy it consistently. An Alteryx workflow with full MRM documentation can — and does.
The Outcome
A fully automated, MRM-compliant Multi-Year Planning pipeline that processes 22 data inputs — AXIS actuarial outputs across all product lines, NER vectors, reinsurance assumptions, intangibles, Kubera, and hedge data — applies 15+ calculated metrics including GAAP and Statutory investment income, MoM change calculations, and account value rollforward, and delivers dual outputs to FP&A Excel and Tableau SQL Server in a single workflow run. What was previously a multi-day manual effort is now a repeatable, documented, auditable process that runs automatically every planning cycle.
Why Rower for Insurance FP&A Automation
Rower Consulting builds data automation for lean teams with enterprise expectations — including FP&A teams at life insurance companies where the regulatory stakes are high and the margin for error is zero.
We work inside the tools you already have — Alteryx, Tableau, Snowflake, SQL Server — and we build the automation layer that eliminates the manual work your team shouldn’t be doing in the first place. Fixed fee. 90 days. We stay until it’s done.
If your MYP process still runs on manual data pulls, this is the conversation to have before the next planning cycle starts.
Technologies Used in This Engagement