










Our Expert Team

Our Unique Approach

Life Sciences

Healthcare

Restaurants & Food and Beverage

Consumer Packaged Goods (CPG)

Survey Data at Scale: Turning Qualtrics Responses into Strategic Intelligence with Snowflake, Alteryx, & Tableau

Survey Data at Scale: Turning Qualtrics Responses into Strategic Intelligence | Rower Consulting
Case Study · Survey Analytics

Survey Intelligence That Moves as Fast as Your Training Does: Qualtrics API, Alteryx, and Tableau

The organization ran large-scale training programs and collected participant feedback through Qualtrics — but insights arrived weeks after the moment to act had passed. Rower built a fully automated pipeline using the Qualtrics JavaScript API, Alteryx, and Tableau. The dashboard populates with fresh data the moment a training session ends. Built in weeks, not months. Zero manual steps.
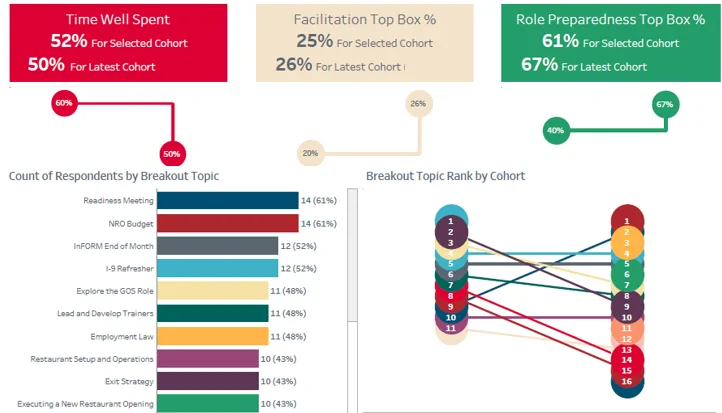
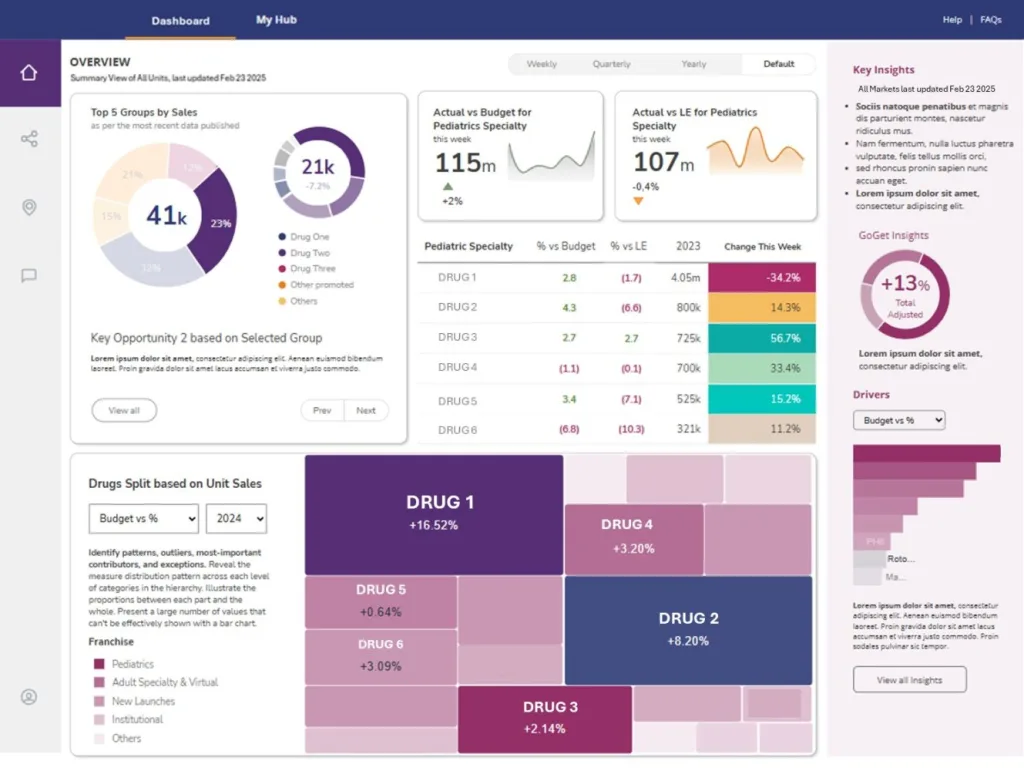
Live Survey Intelligence Dashboard — Tableau
Qualtrics survey analytics dashboard built in Tableau with Alteryx pipeline

The Problem With Manual Survey Analytics

The organization ran training programs across a large, distributed workforce. After each session, participants completed Qualtrics surveys — rating effectiveness, capturing feedback, flagging curriculum gaps. The data was valuable. The problem was what happened next.

Survey responses sat in Qualtrics. Analysts manually exported CSVs. Data was cleaned in Excel. Reports were built by hand. By the time leadership saw the insights, the training cohort had moved on, the facilitators had moved on, and the window to intervene — to adjust curriculum, address a failing module, or recognize a strong instructor — had already closed.

The feedback loop was broken. Not because the data wasn’t there. Because the infrastructure to move it in real time didn’t exist.

⚠ The Core Problem

Survey intelligence that arrives weeks after a training ends isn’t intelligence — it’s history. The organization needed data that moved as fast as its people did.

The Architecture: Qualtrics API → Alteryx → Tableau

Rower designed and built a fully automated survey intelligence pipeline in weeks. The architecture is simple — which is exactly why it works reliably at scale.

Layer 1 — Capture
Qualtrics JavaScript API

We used the Qualtrics JavaScript API to trigger a data extraction the instant a survey is submitted. No manual export. No scheduled batch. The moment a participant completes their training survey, the response flows downstream automatically.

Layer 2 — Process
Alteryx automated pipeline

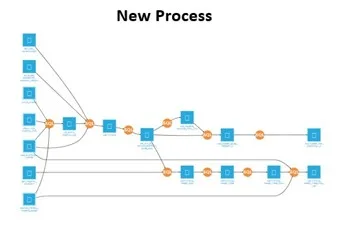
Alteryx receives incoming survey data, applies transformation logic — cleaning responses, calculating scores, mapping to training cohorts, flagging statistical outliers — and outputs a structured dataset ready for Tableau. The workflow runs automatically on every new response.

Layer 3 — Visualize
Tableau live intelligence dashboard

Processed data feeds directly into Tableau. The dashboard refreshes automatically — so by the time a training session ends and the last participant submits, leadership already has a current view of how that session performed.

Design principle
Zero manual steps after launch

Survey submitted → Qualtrics API fires → Alteryx processes → Tableau updates. The entire chain runs without human intervention, every time, for every session across the organization.

What the Dashboard Shows

The Tableau dashboard gives training leaders a real-time view of program performance — broken down by session, facilitator, cohort, region, and individual question. Instead of a summary report weeks after the fact, leaders see:

  • Session-level performance scores — how each cohort rated each training, immediately after it ended.

  • Facilitator effectiveness — who is consistently rated highly, who needs support, and what’s driving the difference across cohorts.

  • Module-level feedback — which parts of the curriculum are resonating and which are consistently flagged as gaps.

  • Trend over time — is program quality improving across cohorts, or are the same problems recurring session after session?

  • Automatic outlier detection — Alteryx flags statistically anomalous responses before they reach the dashboard, so leaders see signal, not noise.

Weeks to Build. Runs Forever.

The entire pipeline — Qualtrics API integration, Alteryx workflow, Tableau dashboard — was designed, built, and live in weeks. Not a multi-quarter enterprise project. Not a custom platform that requires ongoing vendor support to maintain.

That speed is intentional. Rower builds on the tools organizations already own. The Qualtrics instance was already running. Alteryx was already licensed. Tableau was already in the environment. We built the intelligence layer that connected them — and the result was a production-grade automated pipeline that has run without manual intervention since the day it launched.

Every time a training ends, the dashboard updates. Every cohort, every session, every facilitator — current data available before the next training begins.

✓ The Result

A fully automated survey intelligence pipeline — Qualtrics JavaScript API triggering Alteryx, feeding Tableau — that populates a live dashboard the moment a training session ends. Built in weeks on tools the organization already owned. Zero manual steps. Real-time insight that finally matched the pace of the programs it was measuring.
Technologies Used in This Engagement
Qualtrics JavaScript APIAlteryxTableauAutomated PipelineReal-Time Survey ProcessingOutlier Detection

Other Resources

Start your journey

Accessibility Statement

At Rower Consulting, we are committed to ensuring digital accessibility for everyone, including individuals with disabilities. We strive to continually improve the user experience for all visitors and apply the relevant accessibility standards of WCAG 2.1 (Web Content Accessibility Guidelines).

If you encounter any accessibility barriers or have suggestions for improving our website’s accessibility, please contact us through our Contact Form and we will work to address the issue.

Privacy Policy

1. Introduction

Welcome to Rower Consulting (“we,” “our,” or “us”). We are committed to protecting your personal information and your right to privacy. This Privacy Policy explains how we collect, use, disclose, and safeguard your information when you visit our website https://rowerconsulting.com (the “Site”).

Please read this privacy policy carefully. If you do not agree with the terms of this privacy policy, please do not access the site.

2. Information We Collect

We collect information in two ways:

  1. Information you provide to us:
    • Personal information that you voluntarily provide to us when you fill out forms on our Site.
    • This may include your name, email address, and any other information you choose to provide in the form fields.
  2. Information collected automatically:
    • We use Google Site Kit, which integrates several Google services to collect and analyze data about our website visitors.
    • This may include information such as your IP address, browser type, operating system, referring URLs, device information, pages visited, and the dates/times of visits.

3. How We Use Your Information

We use the information we collect for the following purposes:

  • To respond to your inquiries or requests
  • To provide you with information or services you have requested
  • To improve our website and user experience
  • For internal record keeping and administration
  • To analyze website traffic and optimize user experience using Google Site Kit

4. Google Site Kit

We use Google Site Kit to help us understand how visitors interact with our website and to improve our services. Google Site Kit integrates several Google services, which may include:

  • Google Analytics: for website traffic analysis
  • Google Search Console: for search performance data
  • Google AdSense: for advertising performance (if applicable)
  • Google PageSpeed Insights: for website performance data

These services collect non-personally identifiable information which may include:

  • Website traffic data
  • Search query data that led to our site
  • Indexing data
  • Data about how visitors interact with our site
  • Website performance metrics

This information helps us to improve our website and its content. Google’s ability to use and share information collected by Google Site Kit is restricted by the Google Site Kit Terms of Service and the Google Privacy Policy. You can learn more about how Google uses data when you use our site by visiting https://www.google.com/policies/privacy/partners/.

5. How We Protect Your Information

We are committed to ensuring that your information is secure. We have implemented suitable physical, electronic, and managerial procedures to safeguard and secure the information we collect online to prevent unauthorized access or disclosure.

6. Third-Party Sharing

We do not sell or lease your personal information to any third parties. However, aggregated, anonymized data collected through Google Site Kit may be shared with Google as part of the service’s functionality.

7. Cookies and Tracking Technologies

We use cookies to improve your experience on our website. These cookies may collect non-personal information. You can choose to accept or decline cookies. Most web browsers automatically accept cookies, but you can usually modify your browser setting to decline cookies if you prefer.

Google Site Kit may use cookies to collect information. You can learn more about how Google uses cookies by visiting https://www.google.com/policies/privacy/partners/.

8. Your Rights

Depending on your location, you may have certain rights regarding your personal information, such as the right to access, correct, or delete your data. Please contact us if you wish to exercise these rights.

9. Changes to This Privacy Policy

We may update our Privacy Policy from time to time. We will notify you of any changes by posting the new Privacy Policy on this page.

10. Contact Us

If you have any questions about this Privacy Policy, please contact us

Download Rower’s Executive Decision Systems™ Framework​

Get instant access to our proprietary 4-phase methodology.