










Our Expert Team

Our Unique Approach

Life Sciences

Healthcare

Restaurants & Food and Beverage

Consumer Packaged Goods (CPG)

Building Pharma Commercial Intelligence in Tableau: From Persona Design to Live

How We Built a Pharma Commercial Intelligence Platform in Tableau | Rower Consulting
BLOG POST PHARMA COMMERCIAL INTELLIGENCE · TABLEAU · SNOWFLAKE SNOWFLAKE SOURCES Territory Hierarchy Prescriber Data Sales & Forecast Data Market Access Data Wholesaler Feeds INTELLIGENCE LAYER PHARMAIQ COMMERCIAL PLATFORM Persona Design · Role-Based Views Snowflake + Tableau · Row-Level Security AI Insights · HIPAA Compliant EXEC VIEW Commercial Overview Actual vs Budget · Key Insights TERRITORY VIEW Regional Intelligence Map · Growers · Decliners LAUNCH VIEW Launch Tracking Day-by-day · Cohort analysis 5 views role-based intelligence for every commercial persona 90 days from kickoff to live Licensable pre-built · configure to your data · fixed fee
📊 Pharma Commercial Intelligence · Tableau · Snowflake

How We Built a Pharma Commercial Intelligence Platform in Tableau — From Design to Live

Most specialty pharma companies have data. They have Tableau licenses. They have analysts. And they still can’t answer the question their commercial leadership asks every Monday morning: what’s actually happening in our territories — and what do we do about it? This is the story of how we solved that problem.

5
Role-based views — one for every commercial persona from rep to C-suite
90
Days from kickoff to live — including data connection, configuration, and training
1
Trusted view — commercial, sales, and market access finally aligned on the same data

The Problem: Three Teams, Three Versions of the Truth

Commercial, sales, and market access each had their own version of the data. Leadership debates started not with “what should we do” but with “whose numbers are right.” Decisions got delayed. Insight work stalled. The analytics investment that was supposed to change all of this produced dashboards that got glanced at and ignored.

This isn’t a data problem. It’s a design problem. And it’s one we’ve seen across virtually every specialty pharma commercial team we’ve worked with.

What They Had
Why It Wasn’t Working
Multiple dashboards built by different teams
No single source of truth — same metric, different numbers depending on who you asked
Generic one-size views in Tableau
Not built for any specific role — reps, managers, and executives all looking at the same cluttered view
Manual Excel for QC and launch tracking
Error-prone, slow, and invisible — problems surfaced after decisions were already made
Previous analytics investment from a large firm
Delivered reports nobody trusted — one VP described it as “a cardboard facade”
⚠ The Core Issue

The dashboards were built around data availability, not decision-making. Nobody had asked the question that matters: what does each person need to see before they act? Until you design around that question, you’re just building prettier versions of the same problem.

Why Tableau on Snowflake — Not a Custom Web App

Before talking about design, I want to address the question we get asked most often by pharma analytics leaders: should we build this in Tableau, or do we need a custom web application?

The answer, almost always, is Tableau. Custom web apps look impressive in a demo. They also require a dedicated engineering team to maintain, take 6-18 months to build, cost significantly more, and create a vendor dependency that never goes away. We’ve seen pharma companies pay millions to large consulting firms for custom-built platforms that their teams couldn’t manage, couldn’t update, and ultimately stopped using.

Tableau, by contrast, is already in your environment. Your IT team knows it. Your analysts know it. When it’s built right — designed around real decisions, connected to a clean data foundation — it doesn’t just look like enterprise software. It functions like it.

For the data layer, we use Snowflake as the central warehouse. Here’s why that matters specifically for pharma commercial teams:

  • Scale without degradation. Territory hierarchies, prescriber data, wholesaler feeds, and market access data — all in one place, queried at speed without performance issues.

  • Native Tableau connection. Near real-time data refresh without complex ETL pipelines. What changes in Snowflake surfaces in Tableau automatically.

  • Role-based data access at the warehouse level. A territory rep only sees their geography. An executive sees everything. This feeds directly into Tableau’s row-level security — consistent regardless of which view someone is looking at.

  • HIPAA-compliant by design. Cloud-native, encrypted at rest and in transit, with full audit trail capability — meeting the regulatory requirements of commercial pharma environments.

Step 1 — Design Around Decisions, Not Data

The biggest mistake in pharma analytics builds is starting with the data you have and building visualizations from it. We start with the people who need to make decisions. For a specialty pharma commercial team, those are five personas — and each needs a completely different view.

VP
The Commercial VP / C-Suite Leader

Needs one view of the entire business. Actual vs budget vs latest estimate. Which franchises are on track. Which territories are at risk. Key insights surfaced automatically. They should open this on Monday morning and know exactly where the business stands — without asking anyone a question.

RM
The Regional Manager

Needs territory performance mapped and ranked. Growers and decliners visible. Top drugs by region. The ability to walk into a field visit with a clear picture of that territory’s story — not a stack of spreadsheets to decode the night before.

BM
The Brand / Marketing Leader

Needs launch tracking by day. Campaign performance. Actual vs forecasted sales. Real-time visibility into how the market is responding to a launch or promotional push — before the weekly review, not after.

MA
The Market Access Leader

Needs payer mix, formulary status, and access barriers by geography. The intelligence to prioritize where access work will have the most commercial impact — and evidence to support those conversations with payers.

SR
The Sales Representative

Needs their territory. Their prescribers. Their numbers. Personalized, relevant, and simple enough that they spend their time selling — not interpreting reports or building their own spreadsheets to fill the gaps.

Step 2 — Build the Intelligence Layer First

Once we have the personas and their decision questions mapped, we design the intelligence layer — the logic between raw data and what leaders see. This is the step most analytics builds skip entirely. It’s why most analytics builds fail.

Metrics & Calculations
Define once. Use everywhere.

Every metric — actual vs budget, actual vs LE, growth vs prior period, trend direction — defined once at the data layer. The same number in the executive view and the rep’s view. Always.

Anomaly Detection
Surfaces problems automatically.

Logic that identifies unexpected territory drops, quiet prescribers, and products trending the wrong way — surfaced automatically in the Key Insights panel, without anyone having to hunt for them.

Hierarchy Management
Modeled correctly at the source.

National, regional, area, district, territory — modeled in Snowflake and reflected accurately in every view. Get this wrong and your data tells different stories at different levels of the org.

Row-Level Security
Enforced at the warehouse.

Built at the Snowflake level, enforced through Tableau’s data source security. Consistent regardless of which view someone opens. A compliance requirement in pharma — treated as infrastructure, not an afterthought.

Step 3 — Build the Five Views

With the intelligence layer defined, we build the Tableau views in a specific order — from the most strategic to the most operational. Each view is built around one question. Here’s what we built — and what it looks like.
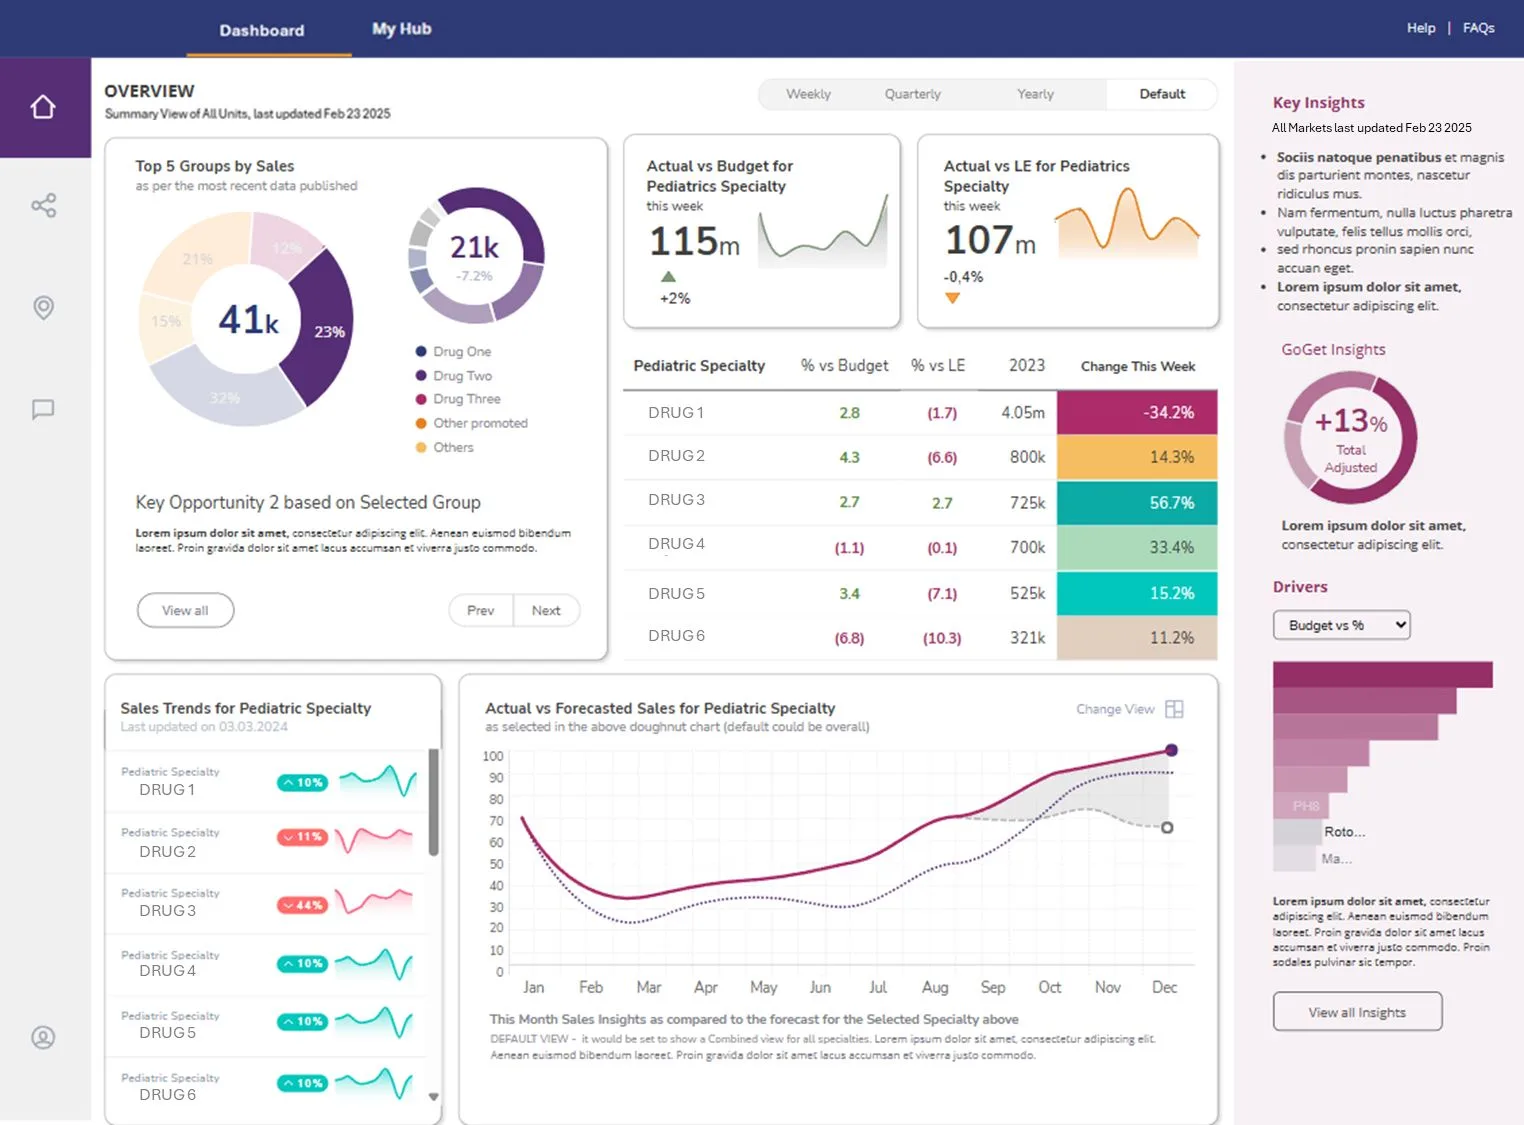
01 Executive Overview — the Monday morning view
“How is the business performing right now?”

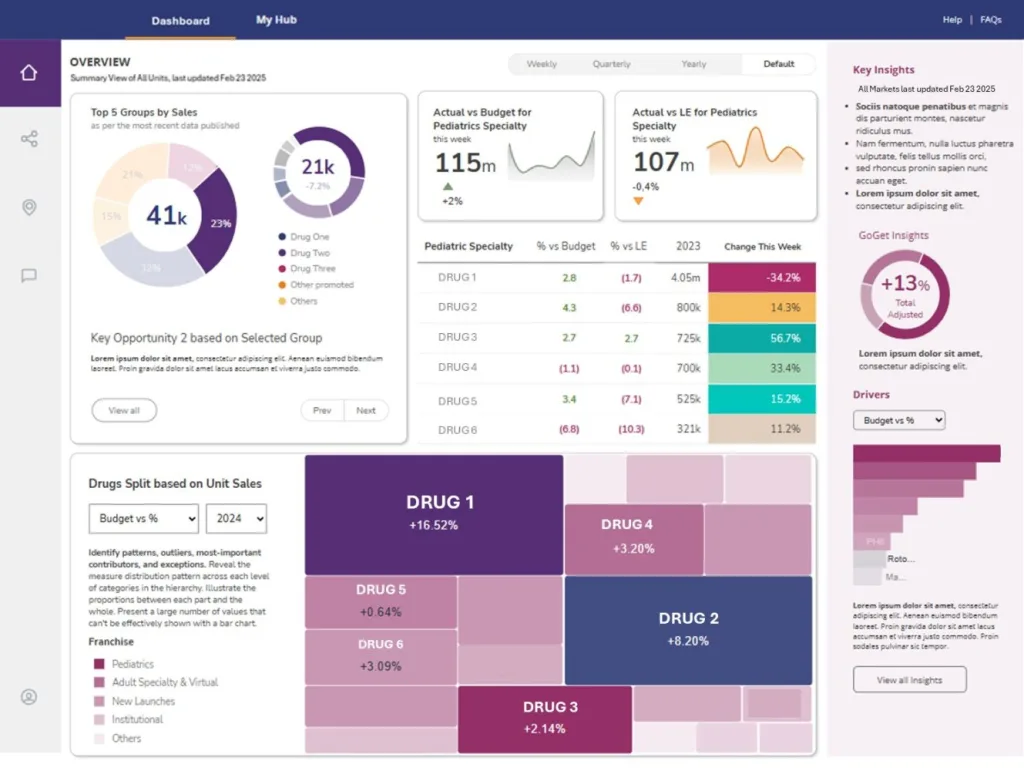
The hardest view to get right. It has to answer the state-of-the-business question at a glance, without any interaction required. Top groups by sales, actual vs budget vs LE, sales trends by brand, forecasted vs actual, and a persistent Key Insights panel that surfaces the most important signals automatically.

PharmaIQ Executive Overview — sales by top markets, actual vs budget, forecasts, key insights
02 Territory Intelligence — the regional map view
“Which territories are growing — and why?”

An interactive map that color-codes performance from poor to good. Growers and decliners ranked and visible. Click any region and drill into the top products, the actual vs forecast delta, and the specific highlights pulling the number up or down. This is the view regional managers open before every field visit.

PharmaIQ Territory Intelligence — interactive map with growers, decliners, and regional performance
Live Interactive — Territory Intelligence
Interact directly · Anonymized data · Not a mockup

See the full PharmaIQ platform running live — territory performance, prescriber intelligence, launch tracking, and market access. Interact with real anonymized pharma data.

Open live platform in Tableau Public →
Opens in a new tab · No login required · Anonymized data
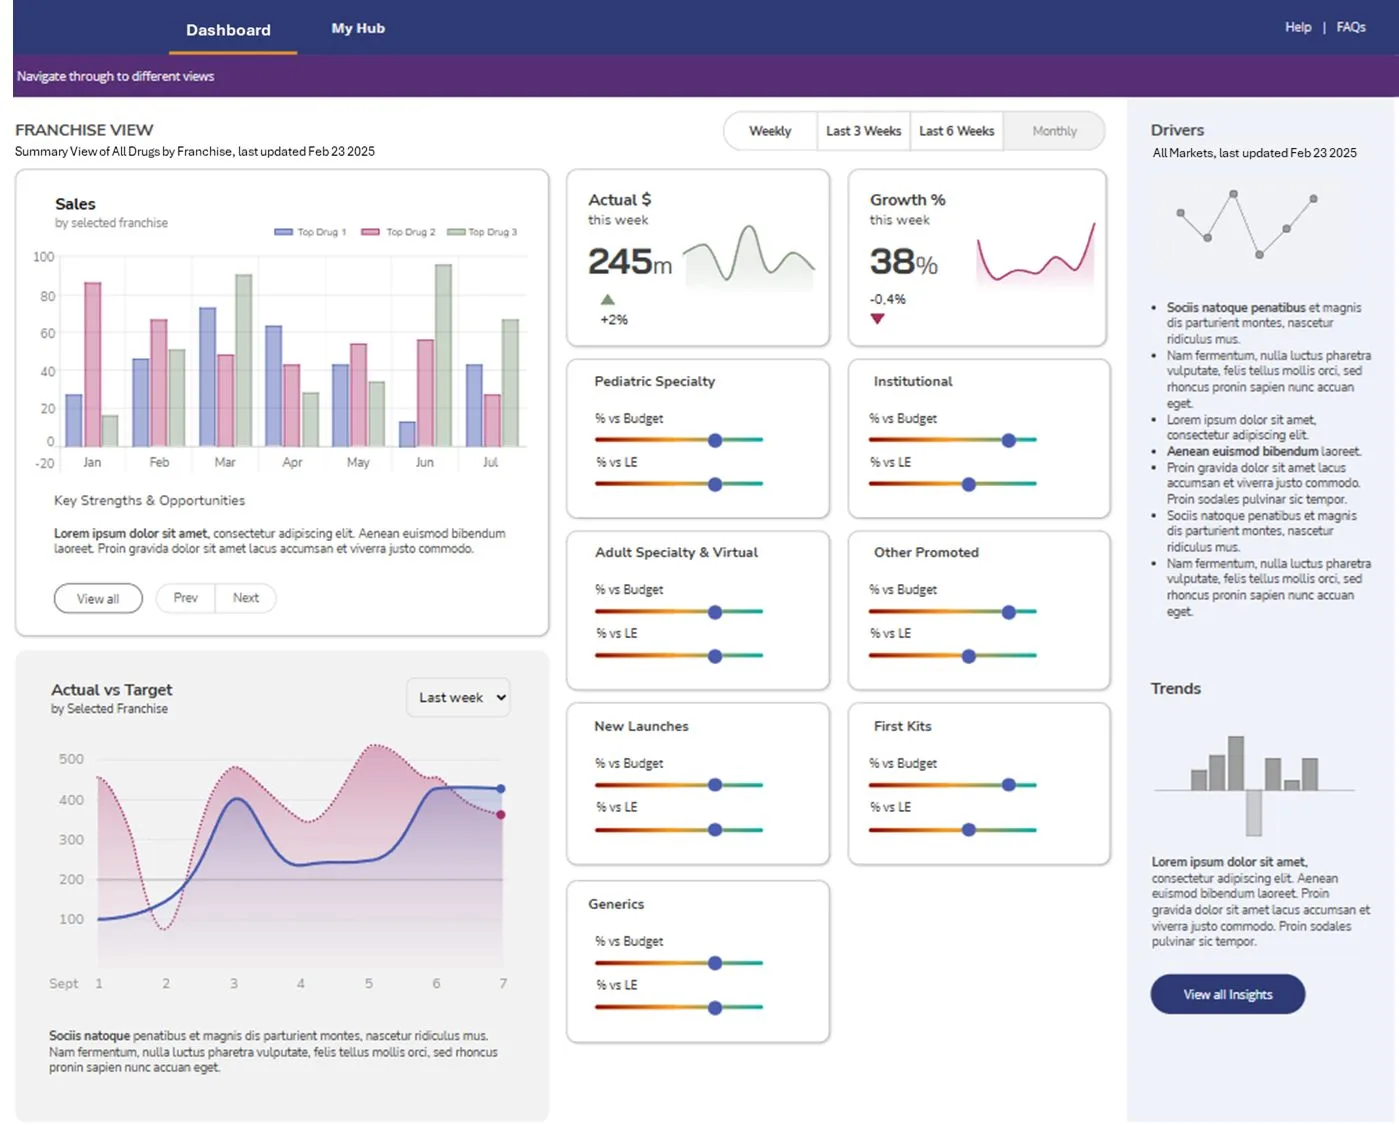
03 Franchise / Brand View — the portfolio view
“How is each franchise performing across specialties?”

How is each therapeutic area performing across the portfolio? Actual vs budget and actual vs LE for every segment — pediatric, institutional, specialty, new launches. Key drivers always visible on the right. The view the brand team lives in.

PharmaIQ Franchise View — actual vs budget and LE across all specialties
04 Launch Tracking — the campaign cohort view
“How is this launch tracking day by day?”

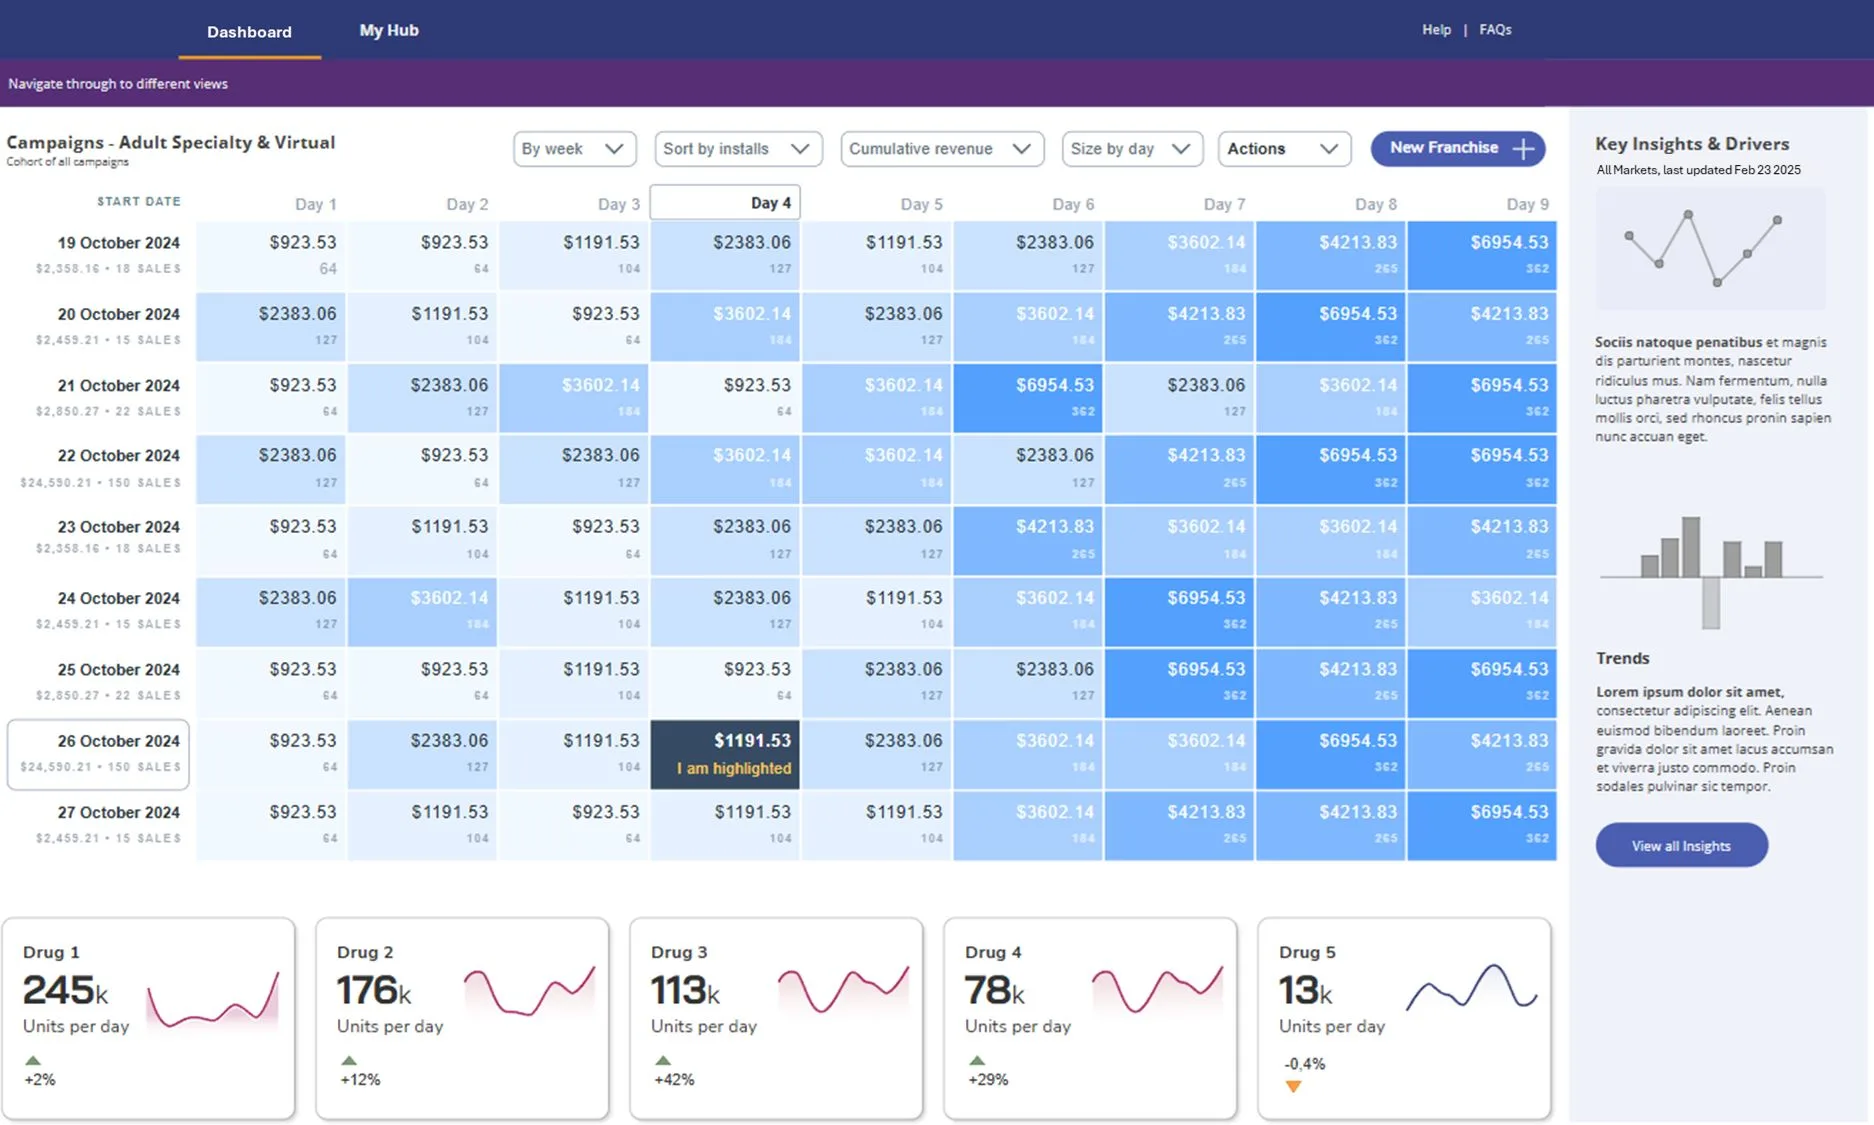
Day-by-day revenue tracking from launch date. Cohort analysis comparing this launch to prior launches. Units per day by product. Color-coded heat maps so patterns are immediately visible without reading a single number. This view consistently gets the most reaction when we demo — because nobody has seen their launch data this clearly before.

PharmaIQ Launch Tracking — campaign cohort analysis with day-by-day revenue and units by drug
05 Personalized View — the role-based rep view
“What does my specific world look like — right now?”

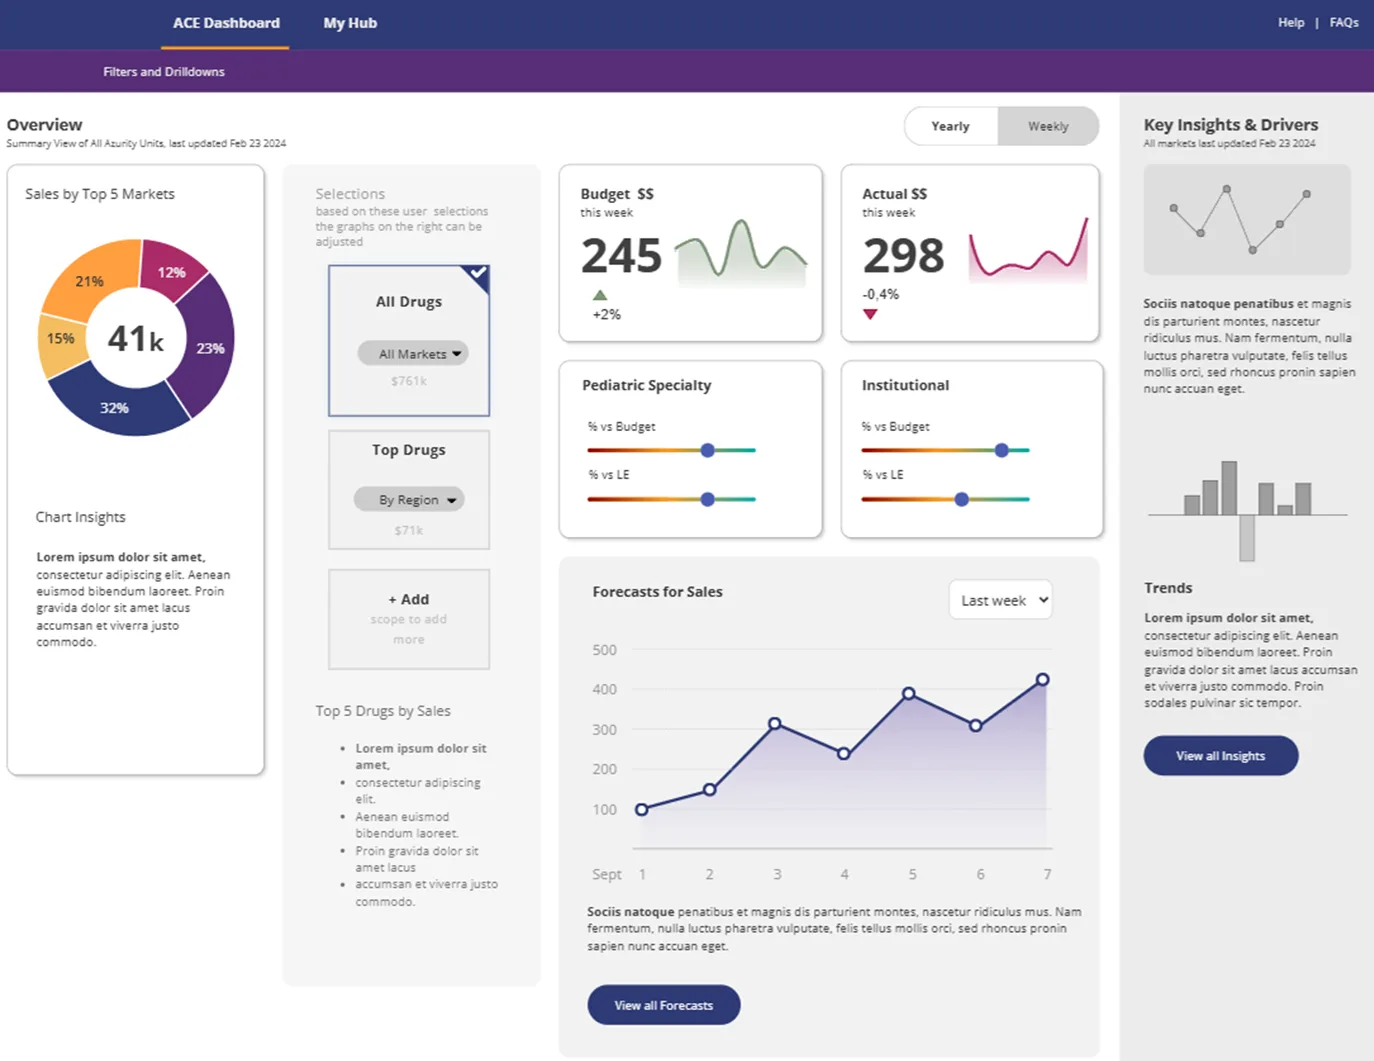
Role-based, filtered to the user’s specific world. The rep sees their territory. The regional manager sees their region. Filters and drilldowns built in. Every user logs in and immediately sees their business — not everyone else’s.

PharmaIQ ACE Personalized View — role-based intelligence for every commercial persona

Step 4 — Design for Adoption, Not Just Accuracy

The most technically accurate dashboard in the world is worthless if nobody uses it. Adoption is the last mile of every analytics build — and in pharma, it’s often where everything falls apart.

On Adoption

Simplicity over completeness. Every metric on a view needs to earn its place. If it’s not answering a decision question, it doesn’t belong. We’ve seen pharma dashboards with 40 metrics on a single view. Nobody makes a decision from that. We aim for 5-7 key metrics per view, at the right level of detail for that persona.

Beyond simplicity, we design for speed. A dashboard that takes 30 seconds to load doesn’t get used. We optimize Snowflake queries, use Tableau extracts where appropriate, and design views that render in under 3 seconds. Speed is a feature, not an afterthought.

We also build consistent navigation across every view — same filter behavior, same color language, same layout patterns. Users learn the system once and navigate every view intuitively. Red means a problem. Green means performance. No legend required.

What Changed When It Went Live

  • The Monday morning debate ended. Commercial, sales, and marketing stopped arguing about whose numbers were right and started discussing what to do about them.

  • Launch visibility improved dramatically. Teams could see how a launch was performing day by day — not week by week when the window to act had already closed.

  • Territory managers went into field visits prepared. A clear picture of their geography’s performance — growers, decliners, top products — before every visit, without manual prep work.

  • The team owns it. Built in Tableau on Snowflake — tools they already had. No vendor dependency. No maintenance burden. The analytics team can update, expand, and build on it themselves.

Now Available to License

PharmaIQ is available to license today.

We built PharmaIQ for a specialty pharma commercial team. The platform is designed to work for any specialty pharma team facing the same problem — and we’ve made it available to license. You’re not commissioning a custom build from scratch. You’re licensing a proven platform that’s already running, already designed for the commercial personas that matter, and already built on the Snowflake + Tableau stack most mid-size pharma teams use.

We configure it to your data, your territory hierarchy, your drug portfolio, and your commercial model.

01 — License
See it. Choose it.

See PharmaIQ running on real pharma data. Every view. Every role. License it the same day if it’s what you’ve been looking for.

02 — Configure
We connect it to your data.

Fixed fee. We connect it to your Snowflake warehouse, configure it to your portfolio, territories, and hierarchy, and build any views specific to your commercial model.

03 — Live
Your team owns it. Forever.

Live in 90 days. No vendor dependency. No maintenance burden. Built in tools your team already knows. Expand it as the business grows.

Fixed fee · 90 days to live · Your team owns it from day one

Frequently Asked Questions

Does this require us to already have Tableau and Snowflake?
Tableau is required — PharmaIQ is built natively in Tableau. Snowflake is our recommended data layer, but we can connect to other warehouses including Databricks, BigQuery, and Redshift depending on your existing infrastructure.
How long does implementation take?
For a standard specialty pharma commercial team, we target 90 days from kickoff to live. This includes data connection, configuration to your territory hierarchy and portfolio, row-level security setup, and user training across all commercial personas.
Can it be customized for our specific commercial model?
Yes. The core platform covers territory performance, prescriber intelligence, launch tracking, market access, and executive overview. We configure these views to your specific portfolio, segments, and hierarchy — and can build additional views for specific needs beyond the core five.
What does licensing cost?
We provide fixed-fee pricing for both the annual license and the implementation engagement. No hourly overruns, no scope creep surprises. Contact us for a pricing conversation.
Is the data HIPAA compliant?
Yes. Data security is built at the Snowflake layer with end-to-end encryption, role-based access control, and audit trails. We configure all environments to meet HIPAA requirements.
We already had a large consulting firm build our analytics platform. Why would this be different?
The difference is ownership and stack. Large firms typically build custom web infrastructure that requires their team to maintain. PharmaIQ is built in Tableau — tools your team already knows. When we hand it over, you own it completely. No ongoing dependency. No support contract required to keep it running.

Technologies Used to Build PharmaIQ

Tableau Snowflake Row-Level Security Role-Based Views AI-Driven Insights HIPAA Compliance Territory Hierarchy Launch Tracking

Other Resources

Start your journey

Accessibility Statement

At Rower Consulting, we are committed to ensuring digital accessibility for everyone, including individuals with disabilities. We strive to continually improve the user experience for all visitors and apply the relevant accessibility standards of WCAG 2.1 (Web Content Accessibility Guidelines).

If you encounter any accessibility barriers or have suggestions for improving our website’s accessibility, please contact us through our Contact Form and we will work to address the issue.

Privacy Policy

1. Introduction

Welcome to Rower Consulting (“we,” “our,” or “us”). We are committed to protecting your personal information and your right to privacy. This Privacy Policy explains how we collect, use, disclose, and safeguard your information when you visit our website https://rowerconsulting.com (the “Site”).

Please read this privacy policy carefully. If you do not agree with the terms of this privacy policy, please do not access the site.

2. Information We Collect

We collect information in two ways:

  1. Information you provide to us:
    • Personal information that you voluntarily provide to us when you fill out forms on our Site.
    • This may include your name, email address, and any other information you choose to provide in the form fields.
  2. Information collected automatically:
    • We use Google Site Kit, which integrates several Google services to collect and analyze data about our website visitors.
    • This may include information such as your IP address, browser type, operating system, referring URLs, device information, pages visited, and the dates/times of visits.

3. How We Use Your Information

We use the information we collect for the following purposes:

  • To respond to your inquiries or requests
  • To provide you with information or services you have requested
  • To improve our website and user experience
  • For internal record keeping and administration
  • To analyze website traffic and optimize user experience using Google Site Kit

4. Google Site Kit

We use Google Site Kit to help us understand how visitors interact with our website and to improve our services. Google Site Kit integrates several Google services, which may include:

  • Google Analytics: for website traffic analysis
  • Google Search Console: for search performance data
  • Google AdSense: for advertising performance (if applicable)
  • Google PageSpeed Insights: for website performance data

These services collect non-personally identifiable information which may include:

  • Website traffic data
  • Search query data that led to our site
  • Indexing data
  • Data about how visitors interact with our site
  • Website performance metrics

This information helps us to improve our website and its content. Google’s ability to use and share information collected by Google Site Kit is restricted by the Google Site Kit Terms of Service and the Google Privacy Policy. You can learn more about how Google uses data when you use our site by visiting https://www.google.com/policies/privacy/partners/.

5. How We Protect Your Information

We are committed to ensuring that your information is secure. We have implemented suitable physical, electronic, and managerial procedures to safeguard and secure the information we collect online to prevent unauthorized access or disclosure.

6. Third-Party Sharing

We do not sell or lease your personal information to any third parties. However, aggregated, anonymized data collected through Google Site Kit may be shared with Google as part of the service’s functionality.

7. Cookies and Tracking Technologies

We use cookies to improve your experience on our website. These cookies may collect non-personal information. You can choose to accept or decline cookies. Most web browsers automatically accept cookies, but you can usually modify your browser setting to decline cookies if you prefer.

Google Site Kit may use cookies to collect information. You can learn more about how Google uses cookies by visiting https://www.google.com/policies/privacy/partners/.

8. Your Rights

Depending on your location, you may have certain rights regarding your personal information, such as the right to access, correct, or delete your data. Please contact us if you wish to exercise these rights.

9. Changes to This Privacy Policy

We may update our Privacy Policy from time to time. We will notify you of any changes by posting the new Privacy Policy on this page.

10. Contact Us

If you have any questions about this Privacy Policy, please contact us

Download Rower’s Executive Decision Systems™ Framework​

Get instant access to our proprietary 4-phase methodology.