


At Rower, we built RowerPharm IQ, a cutting-edge Pharma Intelligence Platform designed to empower stakeholders at every level—from sales representatives to commercial leaders—with actionable intelligence. Our approach to UI/UX ensures that each persona within the industry can extract the insights they need efficiently, making data more accessible, intuitive, and impactful.
Our 10-step UX Design Strategy prioritizes ease of use, personalization, and actionable insights, making complex pharmaceutical data digestible and impactful.
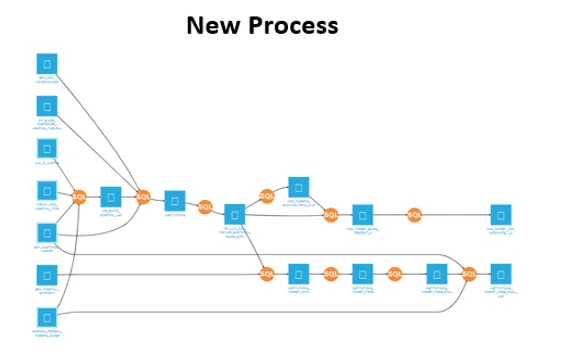
Below, we take a deep dive into our structured design approach:
A seamless, role-based authentication system is the foundation of our UX strategy. Upon logging in, the system identifies the user’s role—whether a sales representative, regional manager, executive, or analyst—and customizes the dashboard, data access, and alerts accordingly.
Key Features
Personalized dashboards displaying role-specific insights
Secure login and access control based on user responsibilities
Prioritization of the most relevant information, ensuring users are not overwhelmed
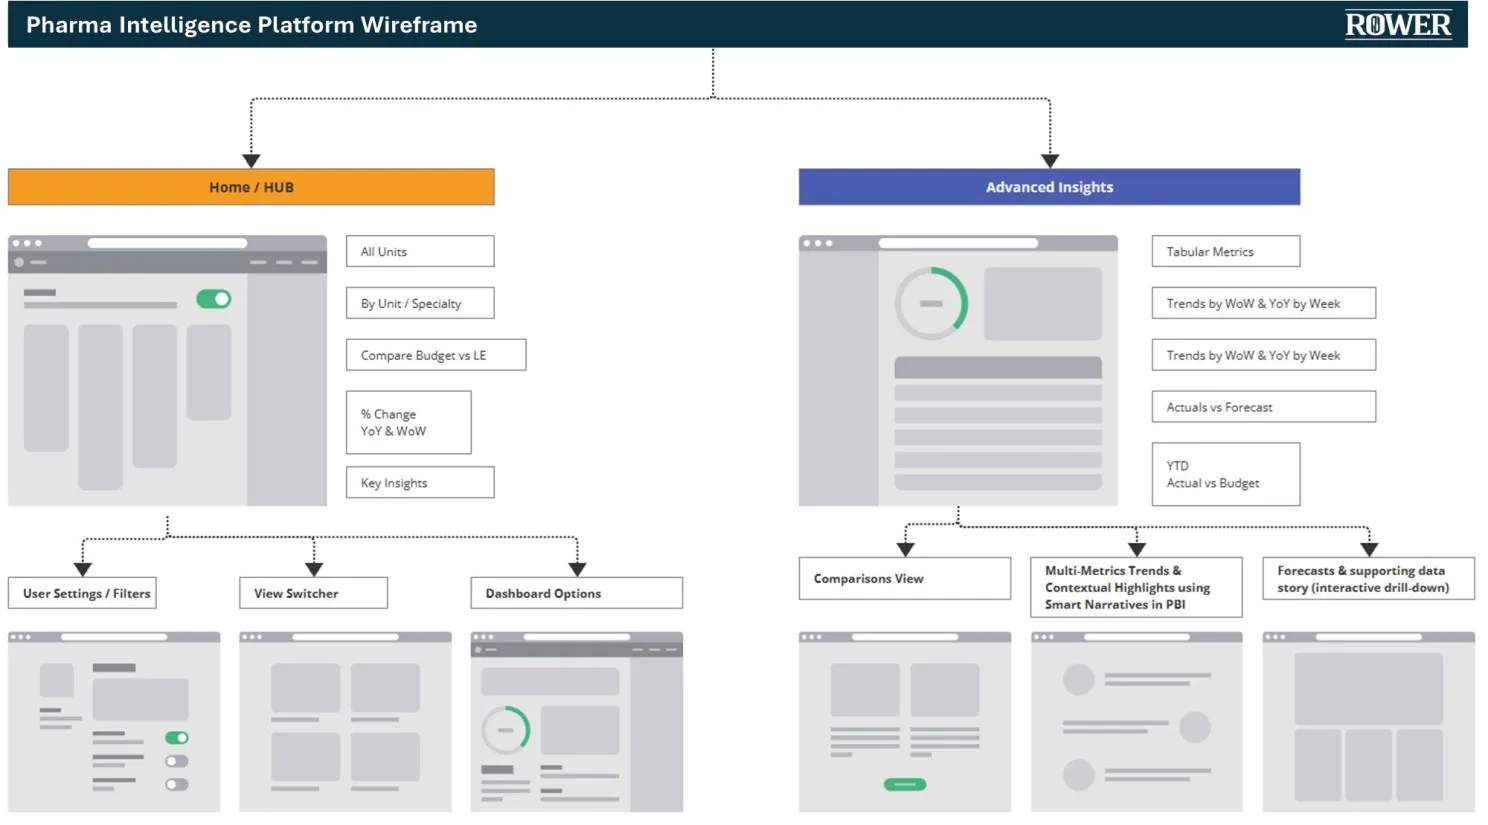
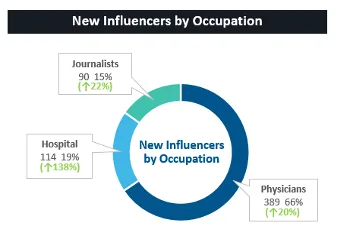
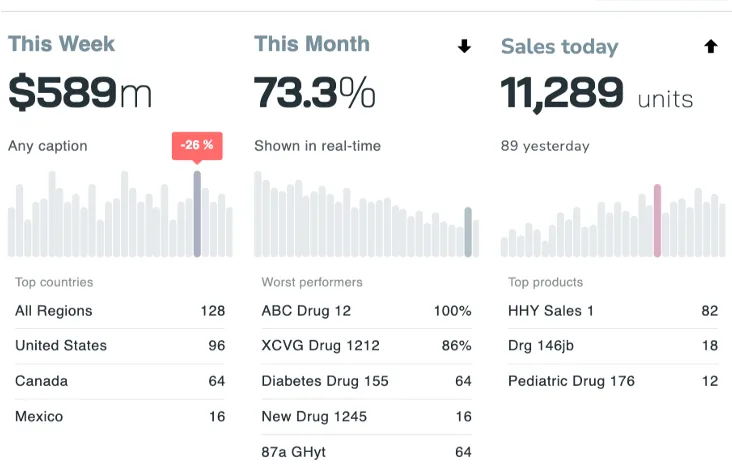
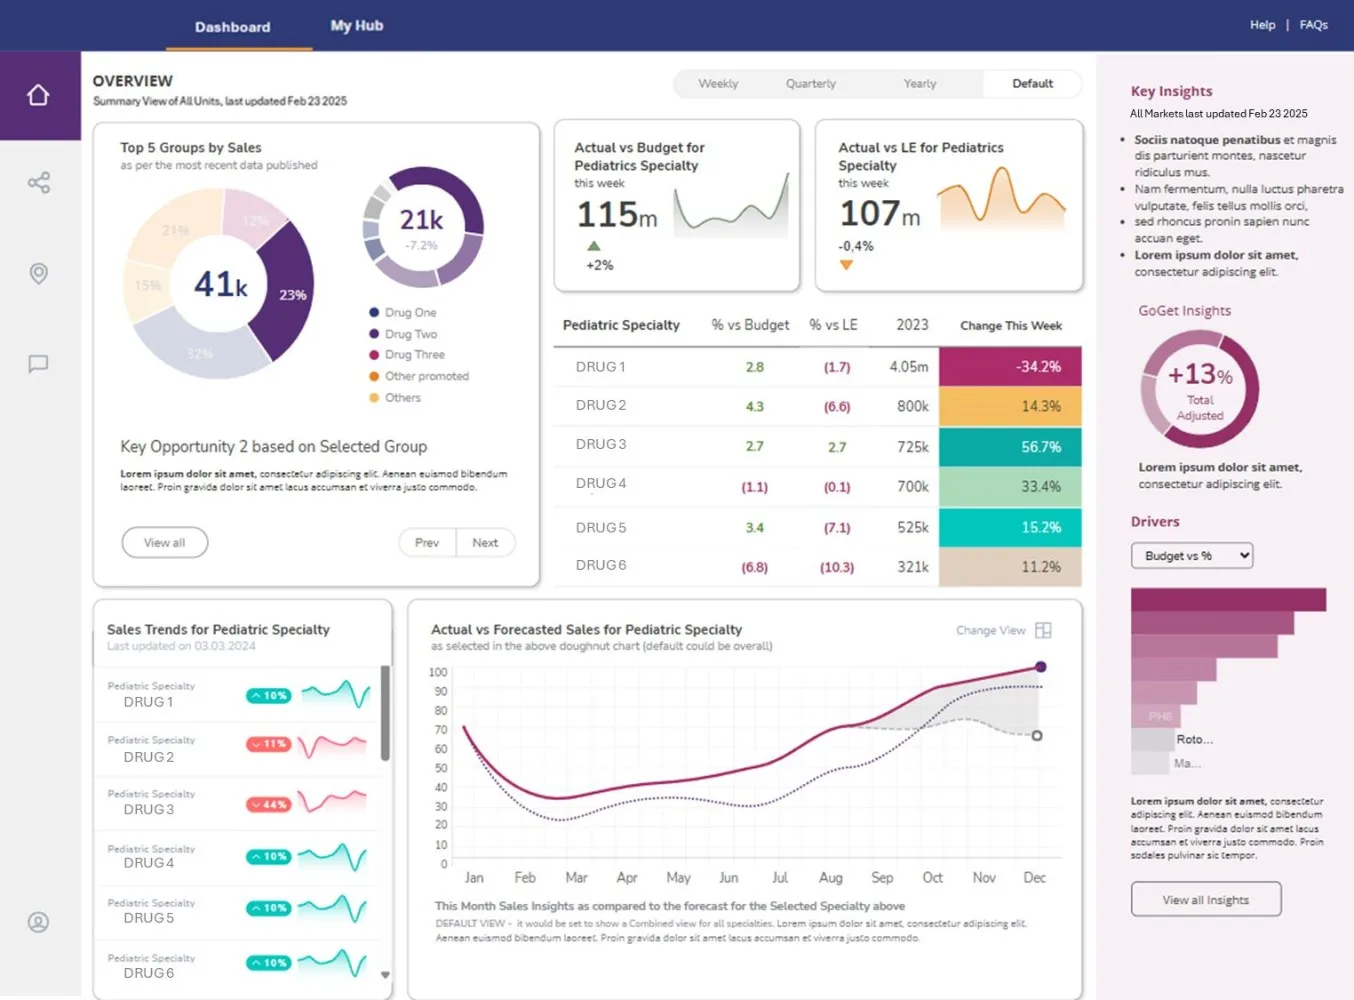
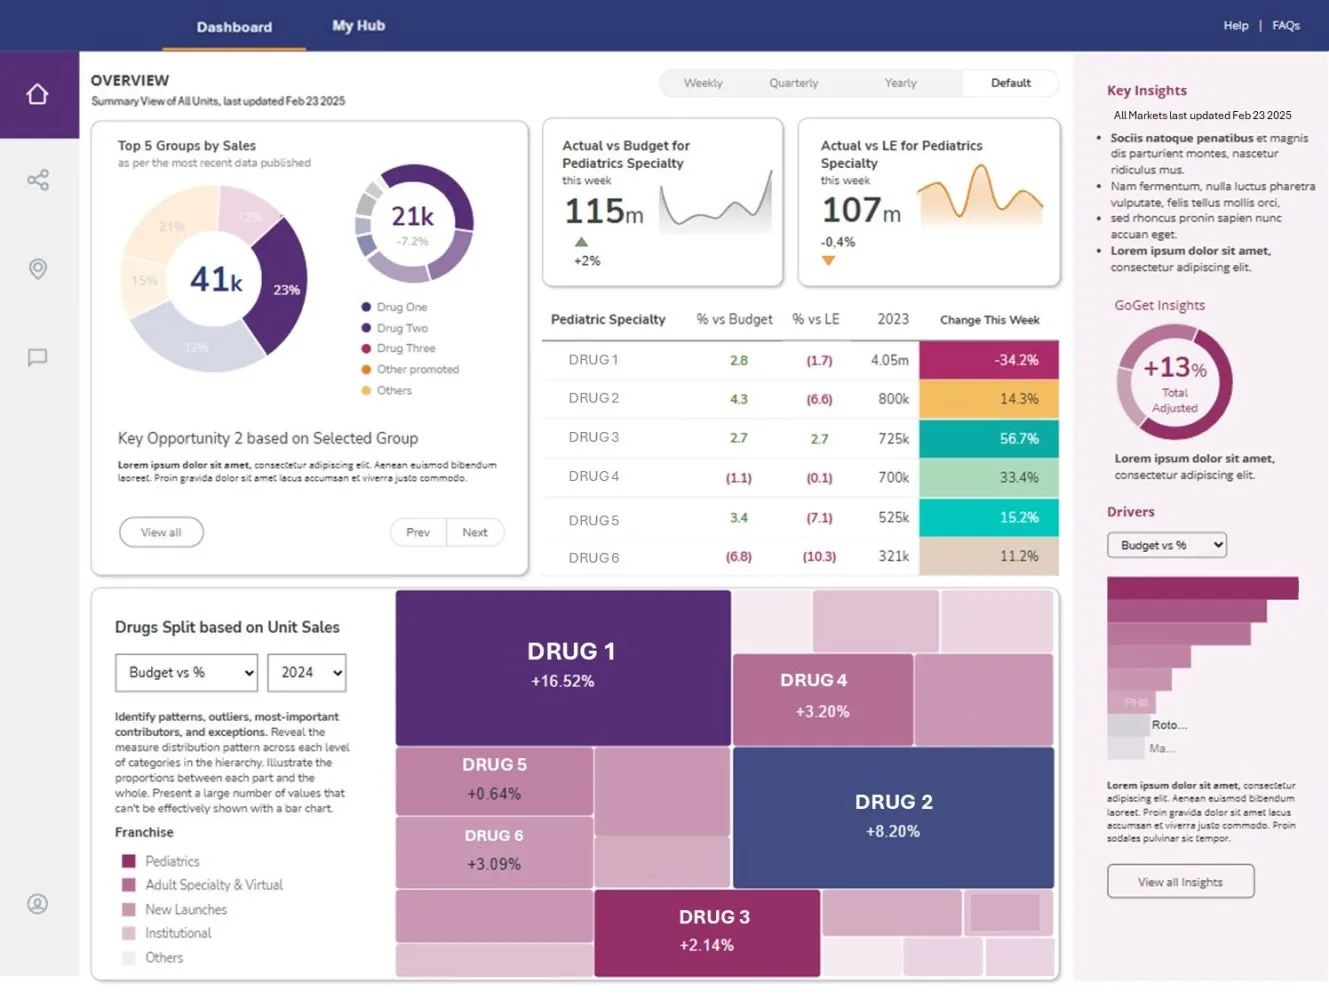
Our intuitive dashboard design aggregates key performance metrics, market trends, competitive analysis, and regulatory updates in a visually compelling format. Users can customize their dashboards to focus on the most relevant KPIs, making data-driven decisions faster and more efficient.
Key Features
Interactive dashboards displaying real-time data
Customizable widgets for role-based relevance
Data drill-down capabilities for in-depth insights
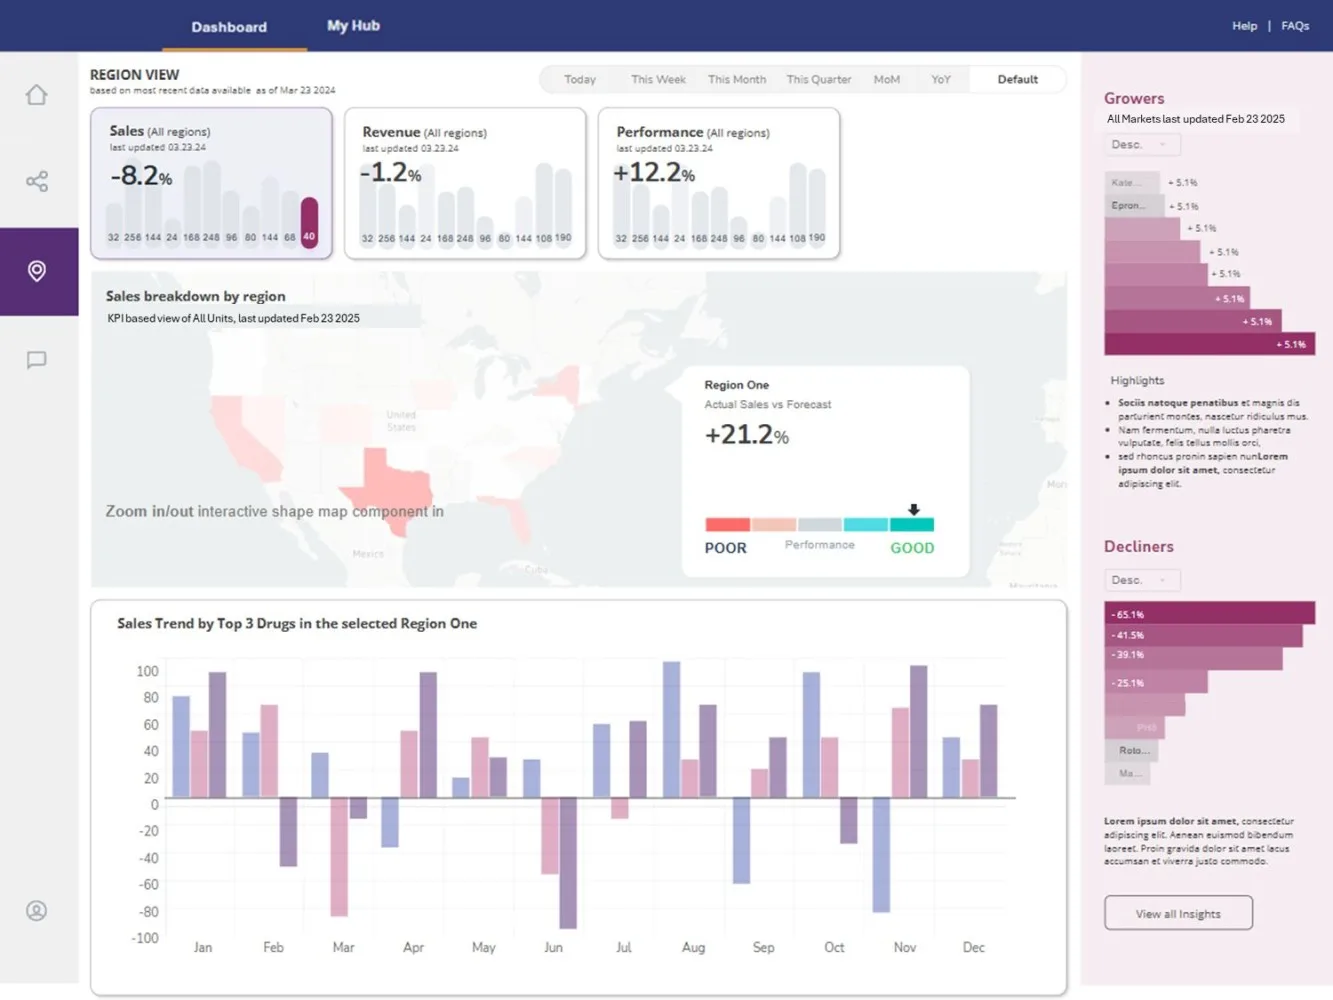
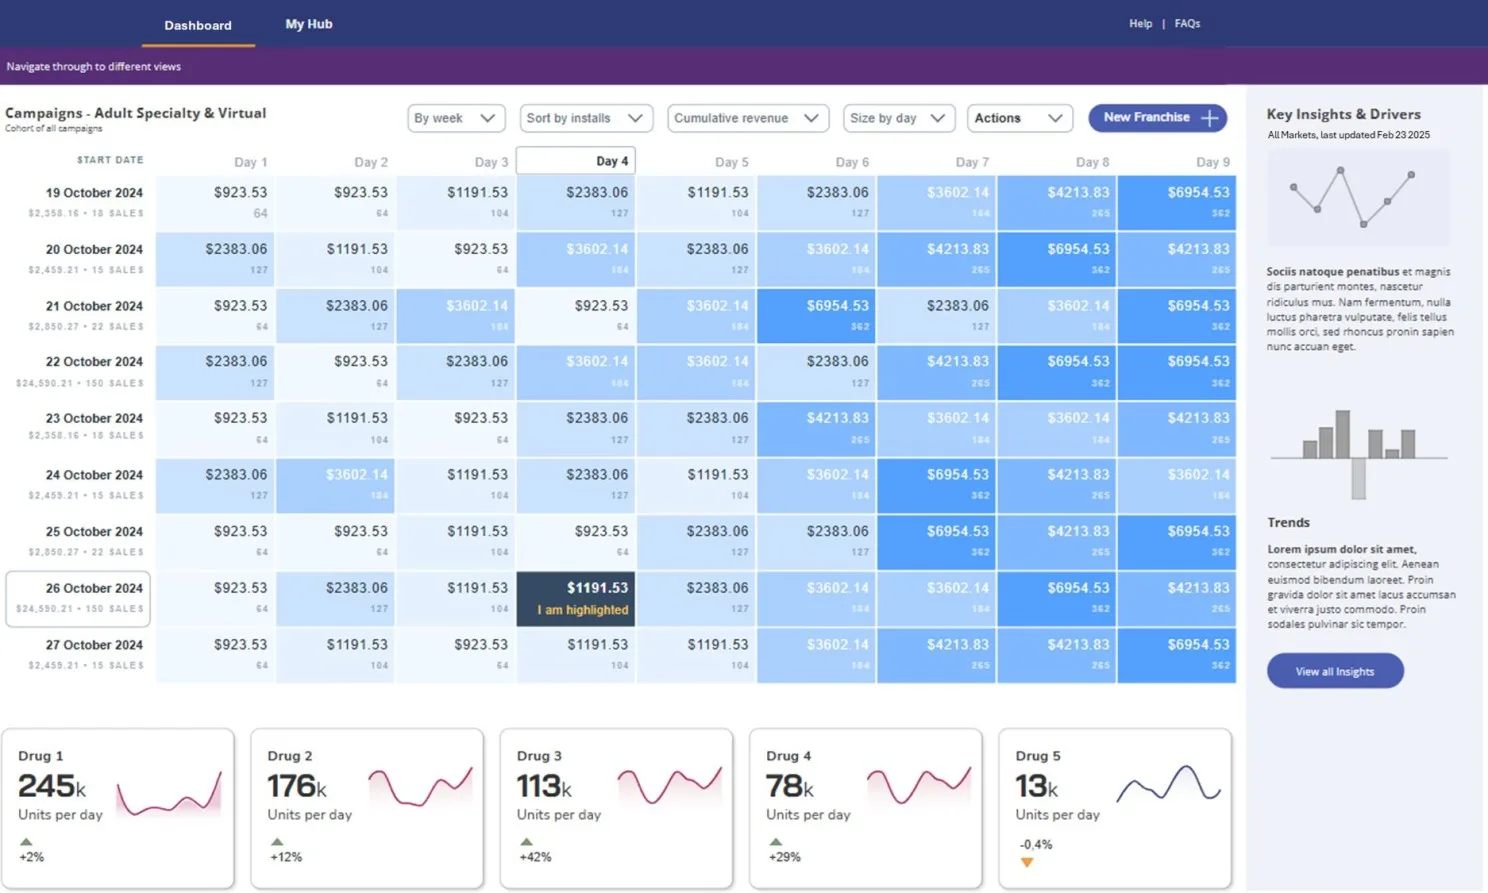
We incorporate advanced search and filtering features, allowing users to explore data by product, region, time period, and other dimensions. Additionally, we use data visualization techniques such as charts, graphs, and heat maps to enhance interpretability.
Key Features
Advanced filtering for granular data exploration
Rich visualization tools for trend analysis
User-friendly analytics for both technical and non-technical users
Our “Insight Panel” feature enables users to investigate anomalies, such as an unexpected sales dip, by identifying contributing factors and potential corrective actions. Additionally, benchmarking tools allow users to compare performance against industry standards.
Key Features
“Insight Panel” for deep analysis of sales trends and anomalies
Benchmarking tools to compare performance with competitors
Predictive modeling to forecast trends and business outcomes
Users can generate and export customized reports in various formats (PDF, Excel, PowerPoint), selecting the most relevant data points, insights, and visualizations for internal use or external presentation.
Key Features
Flexible report generation tailored to user needs
Multi-format exports for easy sharing
Customizable templates for standardized reporting
Collaboration is key in pharma. We integrate collaboration tools that enable teams to share insights, comment on data, and suggest actions directly within the platform. A built-in notification system alerts users to new insights, data changes, or suggestions from colleagues.
Key Features
Real-time collaboration on insights and reports
Internal communication features for better decision-making
Automated alerts to notify users of key updates
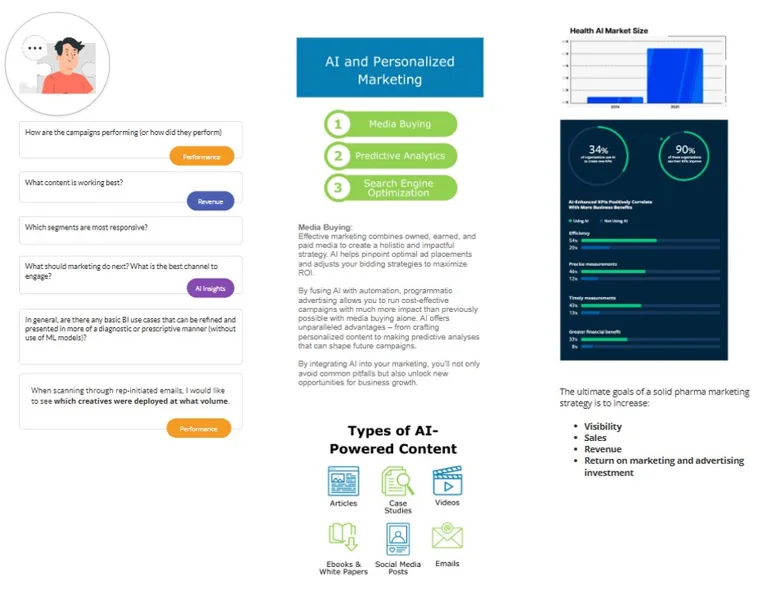
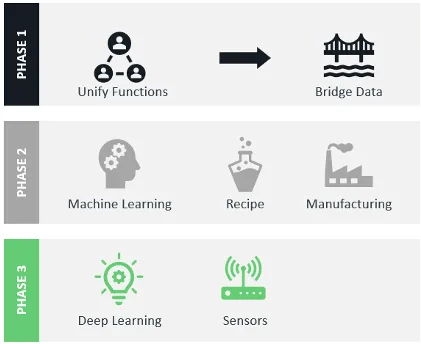
Our platform uses AI-powered analytics to detect patterns, predict trends, and recommend adjustments to strategies. Decision-support tools help users explore potential “what-if” scenarios and optimize sales and marketing strategies.
Key Features
AI-driven automated insights to highlight critical trends
Personalized recommendations for sales and marketing teams
Scenario analysis tools for better decision-making
User feedback is at the core of our iterative design approach. A built-in feedback mechanism allows users to report on usability, insight accuracy, and recommendation effectiveness. Additionally, adaptive learning algorithms enhance the platform experience over time.
Key Features
User feedback collection for continuous improvement
Machine learning-based adaptation to enhance usability
Personalized UI/UX enhancements based on user preferences
To ensure maximum adoption and usability, we provide comprehensive onboarding, training, and support resources. These include tutorials, FAQs, and live support options, ensuring users can navigate the platform with ease.
Key Features
Onboarding sessions for new users
Extensive knowledge base with FAQs and tutorials
Live support for real-time assistance
Given the strict regulatory environment in pharma, we ensure that all data within our platform is encrypted and compliant with industry regulations (e.g., HIPAA in the U.S.). We also maintain audit trails to track user activity and ensure security monitoring.
Key Features
End-to-end encryption for data security
Regulatory compliance (HIPAA, GDPR, etc.)
Audit trails for transparency and accountability
At Rower Consulting, we understand that the pharmaceutical industry operates within a complex, data-heavy environment.
By integrating AI-driven insights, real-time collaboration, and robust security measures, we are redefining UI/UX design in pharma, making data more accessible, impactful, and intuitive than ever before.
Ready to transform your pharma operations with cutting-edge UI/UX?
Bilal Hashim is a seasoned data professional with a passion for helping businesses unlock the power of their data. With years of experience in analytics and a deep understanding of emerging technologies, Bilal specializes in crafting solutions that drive innovation and deliver measurable results.